

Start
$590$990/month
- Ad spend
- up to $3,000
- New creatives
- on Google + Meta plans4 a month
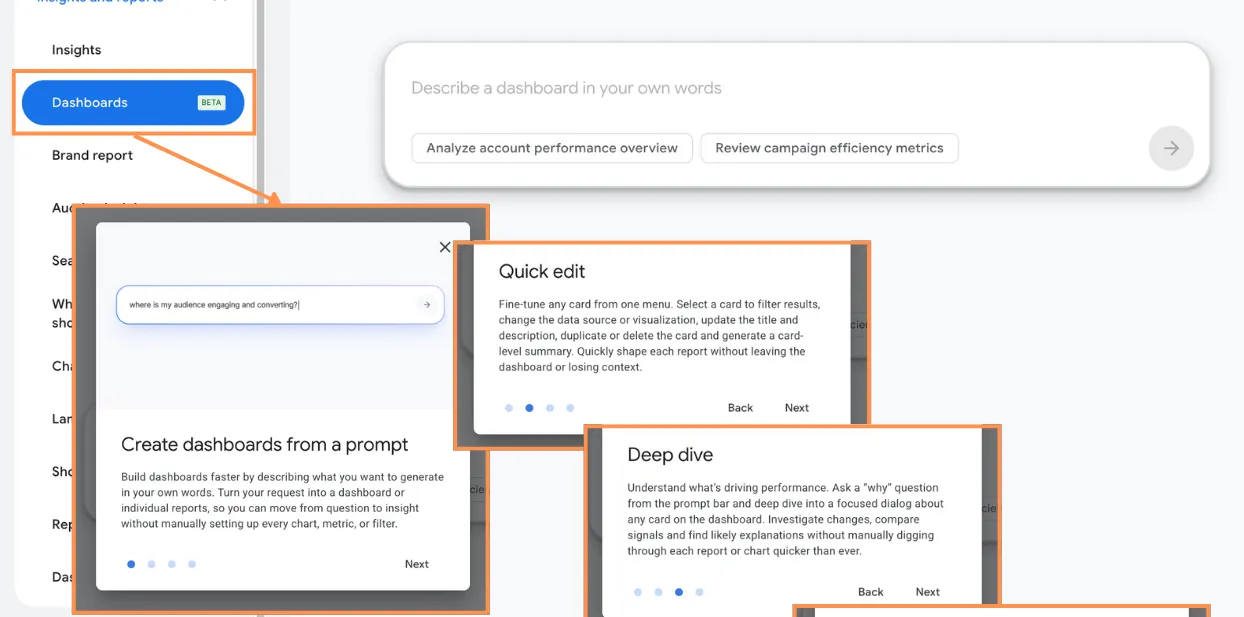
Google Ads appears to be testing a new Dashboards experience within Insights and reports that lets advertisers describe an analysis in plain language and generate a dashboard or individual reports from that request.
For PPC teams, the interesting development is not simply faster report creation. It is the potential move from manually assembling charts to asking a more useful question: what changed, and what may be driving it?
In accounts where the beta is available, the interface indicates that users can prompt Google Ads to create dashboards or reports, then edit individual cards by changing elements such as filters, data sources, visualizations, titles, and descriptions. It also offers summaries for individual cards, a dashboard-level summary based on the selected date range and card context, and a “why” option intended to investigate performance changes.
Google has long provided reporting tools through Report Editor, predefined reports, custom columns, and dashboards. Those tools remain valuable because they give advertisers direct control over metric definitions, segments, filters, and visualization. The new beta seems aimed at reducing the initial setup work: instead of deciding which table, chart, dimension, and comparison period to use, an advertiser can start with an analytical request.
A prompt such as “Show me why leads fell month over month for non-brand Search campaigns” is fundamentally different from “Build a weekly lead report.” The first asks Google Ads to frame an investigation; the second asks it to display data.

The Deep dive capability is the most consequential part of this beta. According to the experience shown in the interface, it can investigate changes, compare signals, and surface likely explanations for a performance movement.
That could be useful in the situations PPC managers deal with constantly: conversion volume drops while spend is stable, CPA rises after a budget change, impression share declines despite higher bids, or revenue shifts across campaign types. Identifying a change is easy enough. Isolating the meaningful contributing factors often requires checking several reports, date comparisons, campaign segments, auction metrics, search terms, device performance, conversion actions, and budget history.
A well-designed AI-assisted dashboard could shorten that first diagnostic pass. It may help teams notice that a decline is concentrated in a particular campaign group, device, location, or conversion action before they spend time on deeper validation.
But “likely explanation” is not the same as proven cause. Google Ads performance is influenced by multiple interacting variables: demand, competition, budgets, targets, query mix, landing-page performance, measurement changes, conversion lag, and changes outside the advertising account. A generated explanation should therefore be treated as a hypothesis for investigation, not a decision-ready conclusion.
That distinction matters most when the recommended response has commercial consequences. Pausing a campaign, changing a bidding target, reallocating budget, or declaring a channel underperforming should still require a review of the underlying data and the broader business context.
The strongest use case may be as an analyst’s starting point rather than a replacement for reporting frameworks. Established dashboards still need fixed definitions, standardized KPIs, trusted date comparisons, and documented attribution choices. These are especially important when performance reports are shared with finance, sales, leadership, or clients.
Prompt-built dashboards could sit above that foundation. They may be useful for exploratory questions, anomaly reviews, campaign triage, and initial performance narratives. The manual report remains the place to validate the finding, inspect the segment, and confirm that the apparent pattern is operationally meaningful.
Google Ads has been steadily adding more AI-assisted workflows across campaign creation, creative production, and optimization. This Dashboards beta extends that direction into marketing analytics. The notable change is not that Google can generate a chart; it is that the interface is beginning to support the question advertisers ask after seeing the chart: why did this happen?
If Google makes the feature broadly available, its value will depend less on how polished the generated dashboard looks and more on how transparent, controllable, and verifiable the underlying analysis proves to be.
$590$990/month
$790$1,290/month
$1,140$1,940/month
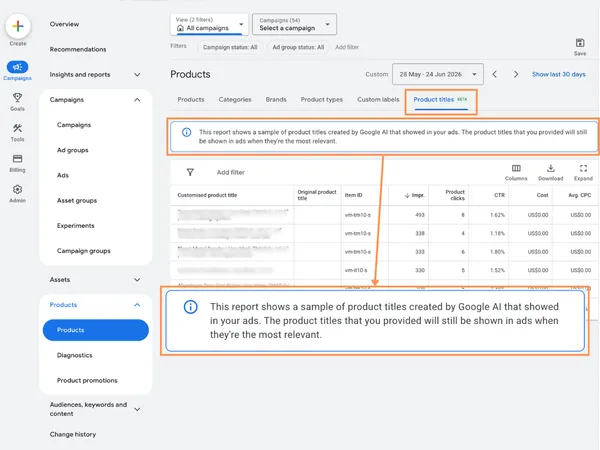 Google Ads tests AI-generated product titles for Shopping ads in beta
 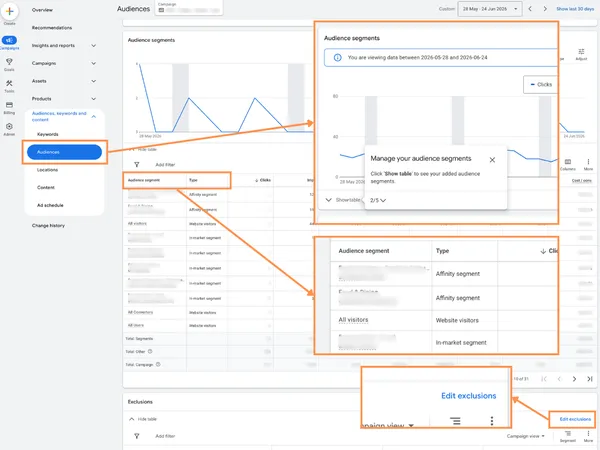 Google Ads adds audience reporting and exclusions to Performance Max
 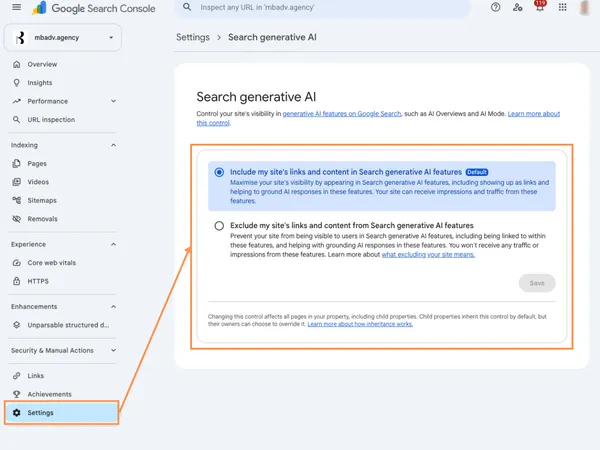 Google Search Console’s Generative AI Control Center: What It Means for SEO and Google Ads
  Google AI Mode queries are 3x longer: what it means for Google Ads strategy
  Google Ads PMax Channel Diagnostics: a better way to audit Performance Max assets
  Google Ads AI Max now adds branded searches control for better brand and non-brand campaign management
  Google Ads Text Disclaimer assets: why this small Search update matters for compliant advertising
 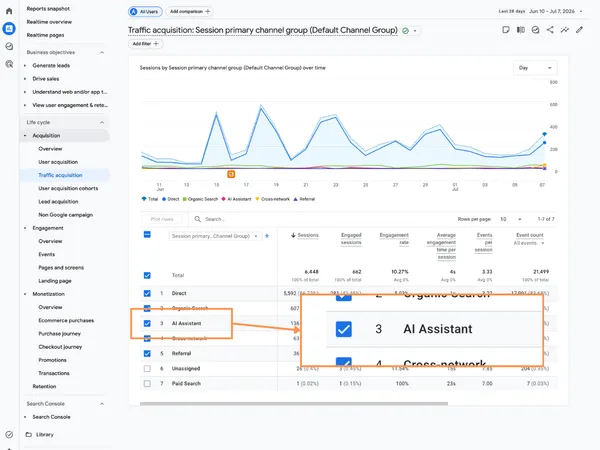 GA4 adds AI Assistant as a Default Channel Group: what it means for SEO, PPC, and attribution
 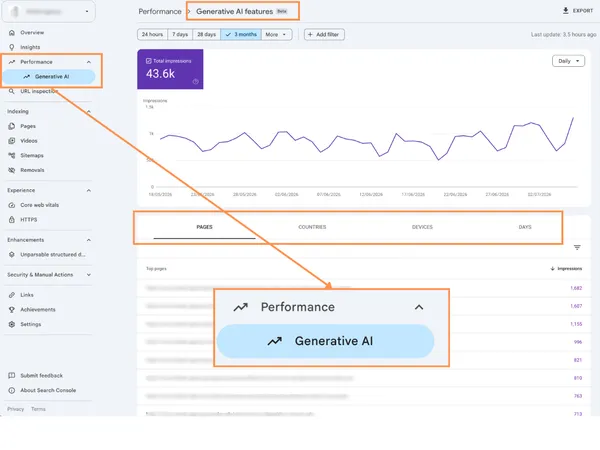 Google Search Console introduces dedicated AI visibility reporting for SEO and search performance
 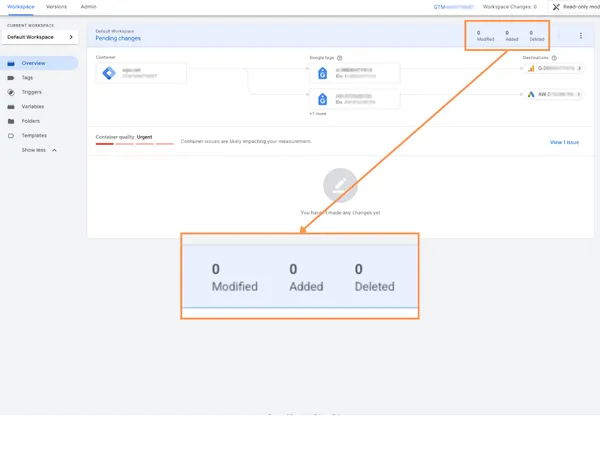 Google Tag Manager visual event builder for Google Ads purchase conversions improves tracking setup
 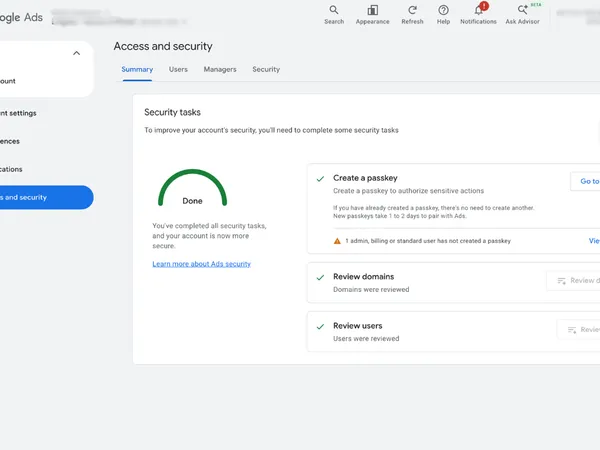 Google Ads adds Security Tasks in Access and security: why the new Summary tab matters
 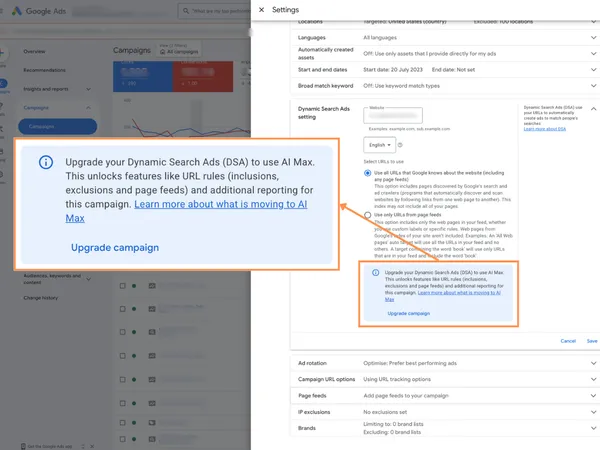 Google Ads delays DSA to AI Max auto-migration until February 2027: what advertisers need to know
Matteo Braghetta founded MB Adv and runs its Google Ads accounts. He takes the first call with every new client, reads the accounts every week and writes the agency’s guides.
The other half of his job is measurement: GA4, Consent Mode and server-side tracking, so the platforms learn from real sales.
MB Adv is a Google Partner agency managing about $4.4M a year in ad spend for clients in the US, the UK and Europe.
Managed on numbers you can check.
Plans for the US