Start
$590$990/month
1 platform · Google or MetaGoogle + Meta- Ad spend
- up to $3,000
- New creativesmade by us
- Google + Meta only4 a month
 By Matteo Braghetta, Founder · Google Ads
New York City processes 30,000–35,000 residential sales per year across five boroughs, each with its own CPC dynamics, buyer demographics, and transaction complexity — and a median sale price of $780,000 means a single closed deal returns $19,500 in commission against a $4,000 monthly ad budget. The agents winning on Google aren't running citywide campaigns; they own a borough.
See how this city's Real Estate PPC costs compare nationally in our Real Estate PPC Statistics report, featuring data from 40+ US cities.
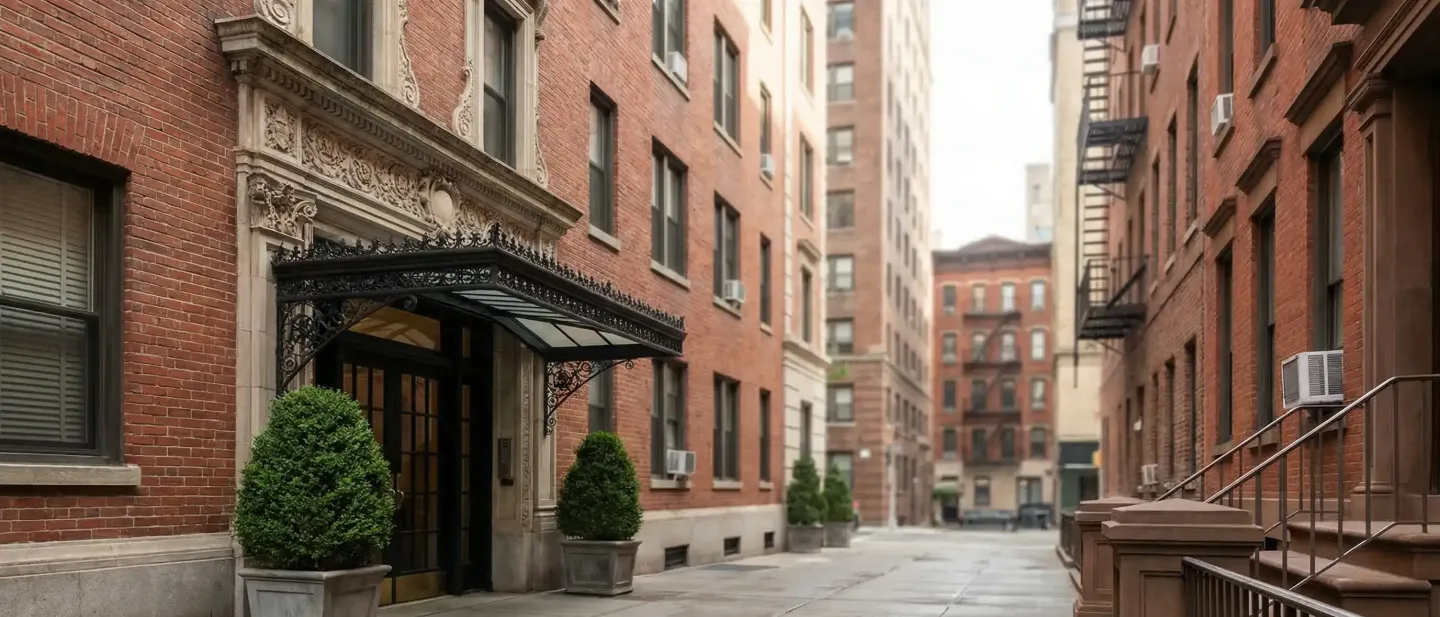
In New York, NY, people search for real estate services about 43,950 times a month on Google; a top-of-page click costs $1.79–$7.10, and demand peaks in March.
Google Keyword Planner · Oct 2025 – Sep 2026
| Search | Monthly searches | Top-of-page CPC |
|---|---|---|
| real estate agent | 9,900 | $3–$11 |
| houses for sale | 9,900 | $0.15–$1.99 |
| homes for sale | 6,600 | $0.16–$2.43 |
| property management | 2,900 | $4–$13 |
| realtor near me | 2,400 | $3–$10 |
| commercial real estate | 2,400 | $0.40–$3.93 |
| condos for sale | 1,900 | $0.21–$1.47 |
| real estate broker | 1,900 | $3–$12 |
| real estate agents near me | 1,300 | $3–$12 |
| first time home buyer | 1,000 | $1.78–$7.02 |
US: $9.02
Google Keyword Planner · Oct 2025 – Sep 2026
Source: Google Keyword Planner (Google Ads), Google Search, English, New York, NY, Oct 2025 – Sep 2026. Volumes are Google's monthly averages; CPC is the top-of-page bid range, weighted by search volume. How we collect these figures.
Real estate PPC in New York City is a market-within-a-market problem. The challenge isn't just competition — it's that NYC's real estate market is structurally unlike any other city in the United States, and most PPC campaigns are built on frameworks designed for suburban, single-family, MLS-driven markets. Applying a standard real estate PPC playbook to NYC produces mediocre results at best and budget blowouts at worst.
At the top of the NYC real estate search landscape sit two forces that no individual agent can outspend: StreetEasy (Zillow-owned) and national portals Zillow and Realtor.com. These platforms dominate organic results for broad terms like "NYC apartments for sale" and "condos for sale New York," then sell premium placement back to agents. Meanwhile, the major brokerages — Douglas Elliman, Compass, Brown Harris Stevens, and Corcoran Group — run eight-figure annual marketing budgets in NYC. Compass alone raised $1B+ in venture capital and deployed significant portions on digital marketing. Direct head-to-head bidding for "NYC real estate agent" against these players produces CPCs of $3–$11 with conversion rates below 2%: an expensive lead that may or may not be remotely serious.
NYC is not one real estate market — it's five distinct markets with different median prices, buyer profiles, and PPC dynamics. Manhattan: Highest CPCs, luxury co-ops and condos, board-approval complexity, highest competition. Brooklyn: Fast gentrification, 2BR condos in Williamsburg now $1.2M–$2M, strong buyer demand but mid-tier CPCs. Queens: Most ethnically diverse county in the world, strong immigrant first-time buyer demand, lower CPCs with comparable intent. Staten Island: 70%+ homeownership rate (highest of the 5 boroughs), suburban single-family market, lowest CPCs of any borough. Bronx: Affordable entry-point; growing investment demand but thin organic buyer pool for PPC; strongest for seller lead campaigns.
The co-op structure alone creates a NYC-specific PPC challenge. ~75% of Manhattan residential units are co-ops, requiring board approval, financial review, and often a 60–90+ day approval process. Buyers searching for co-ops have different intent timelines than condo buyers. Generic landing pages for "Manhattan apartments for sale" fail to address the co-op board process, co-op fees, and flip tax considerations that every Manhattan buyer will encounter. Agents who build landing pages addressing these specifics convert at 3–5x the rate of generic listings pages — and Google rewards the higher engagement with lower CPCs through Quality Score improvements.
Post-NAR settlement (2024), buyer agent compensation norms are in flux nationally. In NYC, buyer agents must now articulate their value more explicitly in advertising copy. Campaigns that don't acknowledge this shift — that still lead with "free buyer representation" or generic "I'll help you find your dream home" copy — are losing to agents who have updated their messaging to reflect the new reality of buyer agent agreements.
The path to profitable real estate PPC in NYC runs through geographic and niche specialization — not broader coverage. The framework: own one borough (or one neighborhood within a borough), target the buyer or seller type that matches your expertise, and build landing pages specific enough that they answer the real question the searcher has.
Campaign structure should mirror the geographic logic: one campaign per borough (or neighborhood cluster), with ad groups for buyer type (first-time, trade-up, investor, seller). This structure allows budget reallocation based on seasonal market activity — NYC's spring market (March–May) and fall secondary market (September–October) require different budget allocations than the summer and holiday periods.
Remarketing is essential in NYC real estate given the long decision cycle. Co-op buyers often research for 3–6 months before submitting an application. Google Display remarketing at $0.25–$0.75 CPM keeps your brand visible across that full research window — for pennies per impression. Combine with email capture on home valuation landing pages for a remarketing list of warm seller leads.
NYC's real estate PPC market contains structural inefficiencies that reward informed operators. Three of the most significant are systematically underexploited by the market.
Every major NYC real estate brokerage and aggregator focuses PPC budget on buyer campaigns. Seller lead campaigns — "What's my apartment worth in Brooklyn?", "NYC home valuation," "how much can I sell my co-op for?" — are dramatically underserved. Seller lead CPL can run $5–$25, compared to $80–$250 for buyer leads. A $2,000/month seller lead campaign in Brooklyn can generate 80–200 home valuation inquiries per month. Even at a 5% conversion to listing (industry average), that's 4–10 new listings with a potential gross commission of $15,000–$35,000 each. No buyer campaign at any budget level comes close to that CPL-to-value ratio in NYC.
Queens County is the most ethnically diverse county in the United States. Its largest communities include Dominican, Chinese, Indian, Korean, and Guyanese populations — many of whom are first-generation property buyers making the most significant financial decision of their lives. Mandarin-language real estate campaigns for Flushing and Sunset Park are priced in their own auction, as are Spanish-language campaigns for Jackson Heights and Corona buyers. These demographics represent first-time buyers who are actively saving for down payments, qualifying for FHA and state first-time buyer programs, and actively searching — but in their native languages. The number of Queens real estate agents running Mandarin or Spanish PPC campaigns with borough-specific landing pages is negligible. The opportunity is open today.
Staten Island is the borough most consistently ignored by NYC real estate PPC advertisers — and the one with the best structural characteristics for independent agents. 70%+ homeownership rate means a genuine suburban owner-occupant market with repeat transaction behavior. CPCs are the lowest of any NYC borough. The median home price is ~$560,000, generating commissions of $14,000+ per closed sale. And the competition from major Manhattan brokerages is thin: Douglas Elliman and Compass are underweighted in Staten Island relative to their Manhattan and Brooklyn presence. An independent agent who builds a Staten Island PPC presence today faces dramatically less competition than any other NYC geography.
One more structural factor: NYC's rental market generates consistent PPC opportunity that most agents ignore. NYC median one-bedroom rent is $3,500/month. Rental agents earn 1–2 months rent per placement ($3,500–$7,000). At modest rental CPCs and CVRs of 4–8%, a focused rental campaign in a single neighborhood (say, "Astoria Queens apartments for rent") can generate low-cost leads — a reasonable return on a $3,500–$7,000 commission per placement.
Underserved NYC real estate PPC segments by borough — ranked by opportunity-to-competition ratio:
NYC real estate PPC requires knowledge of co-op board timelines, borough CPC dynamics, NAR settlement implications, and multilingual market segments — none of which are in a standard agency playbook. Applying a national real estate PPC template to NYC generates average results in an above-average market.
MB Adv Agency builds NYC real estate campaigns from the borough level up: neighborhood-specific landing pages, co-op/condo-aware ad copy, seller lead programs designed around NYC's home valuation dynamics, and bilingual campaign buildouts for Spanish and Mandarin audiences. Our lead generation service is structured around cost-per-signed-agreement — not cost-per-click or cost-per-inquiry.
The math for a Brooklyn agent running a well-structured campaign is straightforward: one closed sale at median Brooklyn price ($850,000) generates ~$21,250 in commission at 2.5%. A $4,000/month PPC budget with a 3% CVR and 20% inquiry-to-close rate generates 3–5 closed transactions per month. That's $63,750–$106,250 in gross commissions on $4,000 in ad spend — a 16x–27x return before expenses.
Learn more about our approach on our services page, review our management pricing, or see our full New York City PPC services page for market-specific campaign examples and NYC case studies.
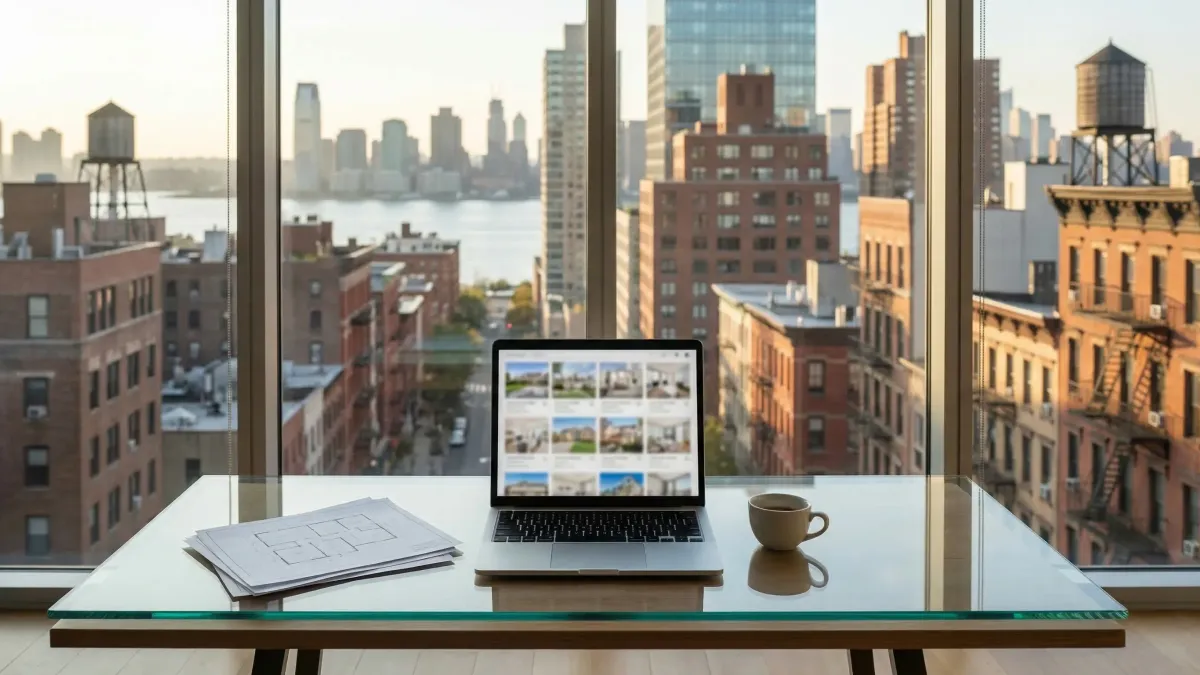
NYC real estate PPC is expensive by national standards but reasonable relative to the commissions at stake. Buyer search campaigns run $1.79–$7.10 per click for sales-focused keywords. National average is $2.37/click (WordStream 2025). However, NYC commissions justify the premium: a $780,000 median sale at 2.5% generates $19,500, meaning a single closed deal returns 5x a typical monthly ad budget.
At a $3,000–$5,000/month budget, a borough-focused campaign should generate 20–50 buyer inquiries per month with CPLs of $80–$160. For a solo agent closing 15–20% of inquiries, that's 3–10 closings per month at $4,000 budget — transformative economics for an independent agent.
Seller lead campaigns are dramatically cheaper: $2,000/month can generate 80–200 home valuation inquiries with CPLs of $5–$25. Seller leads require more nurturing (6–12 month average time-to-listing in NYC), but the pipeline value is exceptional once built. We recommend agents run parallel buyer and seller campaigns with separate budgets — the seller program builds a future pipeline while buyer campaigns generate near-term commissions.
Seasonal budget allocation matters: NYC's spring buying season (March–May) and fall market (September–October) generate 40–50% higher lead volume than winter months. Agents who scale budget $500–$1,000/month higher during peak season consistently outperform those running flat budgets year-round.
Both have a role — but for most independent NYC agents, Google Ads generates a significantly better ROI than Zillow Premier Agent when campaigns are built correctly. Here's why: Zillow Premier Agent charges per lead delivery in a shared model — your lead may go to 2–3 other agents simultaneously, the contact information is pre-populated (reducing friction but also exclusivity), and Zillow's platform CPL in NYC runs $200–$500 per delivered lead. You're renting access to their audience and competing for the same leads your competitors just received.
With Google Ads, clicks come from searches with specific intent — "Brooklyn condo under $800K," "Astoria Queens homes for sale" — and they land on your branded page exclusively. No competing agents. CPL from a well-structured Google Ads campaign runs $80–$160 for buyer leads, and the leads that convert are sourced entirely to your brand. Over time, this builds a sustainable channel that compounds rather than requiring ongoing platform fees for the same audience.
The exception: Zillow Premier Agent is worth using during peak market periods (spring/fall) as a volume supplement, not a replacement. NYC's spring inventory surge generates leads faster than any single organic or paid search channel can capture alone. Running both Google Ads (lower CPL, exclusive leads, brand-building) and a limited Zillow Premier Agent budget (volume supplement during peak season) produces better full-year results than either channel alone. Budget allocation: 70–80% Google Ads, 20–30% Zillow during peak months.
How to read this Cost per click and monthly searches are measured with Google Keyword Planner (see above). Cost per lead, conversion rate, budget and leads are estimates compiled from public benchmarks such as WordStream, not measurements.
Sources WordStream/LocaliQ 2025 Real Estate benchmarks; NYC premium 3-10x national avg CPC; Seattle Phase 2 cross-reference ($4-$14 CPC); REBNY NYC data
$590$990/month
1 platform · Google or MetaGoogle + Meta$790$1,290/month
1 platform · Google or MetaGoogle + Meta$1,140$1,940/month
1 platform · Google or MetaGoogle + MetaChatGPT Ads: a separate pilot, $250/month, added to a plan. See the pilot →

Matteo Braghetta founded MB Adv and runs its Google Ads accounts. He takes the first call with every new client, reads the accounts every week and writes the agency’s guides.
The other half of his job is measurement: GA4, Consent Mode and server-side tracking, so the platforms learn from real sales.
MB Adv is a Google Partner agency managing about $4.4M a year in ad spend for clients in the US, the UK and Europe.
Managed on numbers you can check.
Plans for the US