
How Much Does Google Merchant Center Cost? (2026)

Google Merchant Center Cost 2026
$0
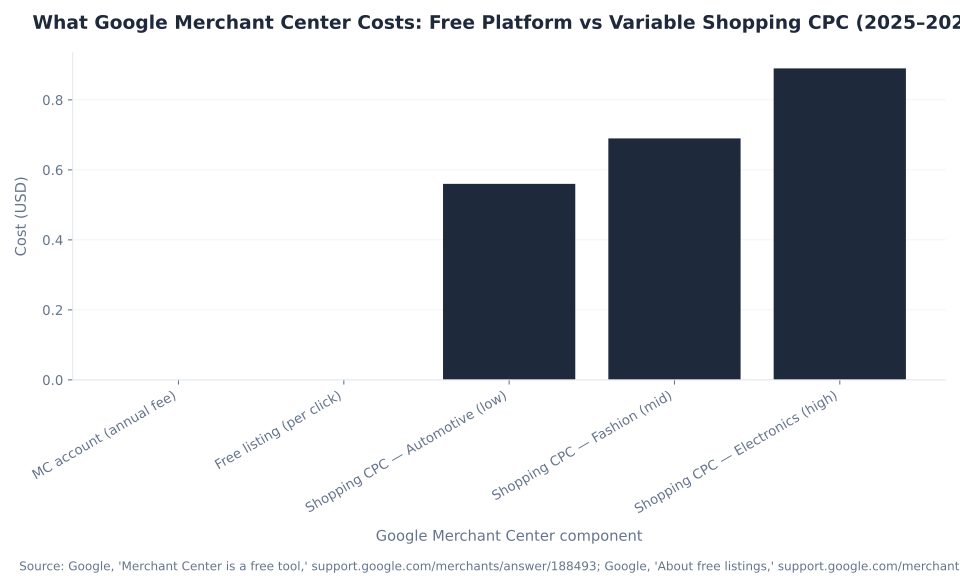
Merchant Center Next is free — no account fee, no listing fee, no per-product charge. You pay only for Shopping ads and Performance Max via Google Ads CPC.
Free product listings: $0 per click · smec European Standard Shopping median ≈€0.38 (Jun 2026) · AdBacklog global Shopping range $0.56–$0.89 by industry (2025)
How Much Does Google Merchant Center Cost in 2026?
Google Merchant Center (now Merchant Center Next, the rebuilt platform all retailers migrated to by September 2024) costs $0. There is no account fee, no listing fee, and no per-product charge. Free product listings — your products appearing on the Shopping tab, in Google Search, Images, Lens, YouTube, Maps, and Google’s AI surfaces — run at no cost with no clicks charged, per Google’s own documentation. The literal answer to “how much does Google Merchant Center cost?” and “is Google Merchant Center free?” is identical: the tool is free.
What costs money is what comes after the catalog: the paid Shopping ads and Performance Max campaigns you choose to run through a linked Google Ads account. Those are CPC-priced — you pay per click on a paid ad, at a rate set by your bids and the Shopping auction, on a daily budget you control. Table 1 below gives the cost answer at a glance; the sections that follow decode the billing model and the Shopping CPC benchmarks from named sources.
| Item | Cost | What it requires |
|---|---|---|
| Merchant Center Next account | $0 — free | Google account; business info; verified and claimed website |
| Product catalog / data source (feed) | $0 — free | Product data via any supported input method: file upload, Google Sheets, API, or automatic crawl |
| Free product listings (Shopping tab, Search, Images, Lens, YouTube, Maps, AI surfaces) | $0 — free; no cost per click | Merchant Center account + product data source; no Google Ads account needed; enabled by default on new accounts under Marketing → Marketing methods |
| Standard Shopping ads (paid; created in Google Ads) | CPC — you pay per click; budget you set. smec European median ~€0.38 (Jun 2026); AdBacklog global range $0.56–$0.89 by industry (2025) | Linked Google Ads account + active Shopping campaign + daily budget you set |
| Performance Max campaigns (paid; any campaign created inside Merchant Center) | CPC — Smart Bidding; budget you set. smec European median ~€0.40 (Jun 2026) — ~5% above Standard Shopping | Linked Google Ads account + Performance Max campaign + daily budget; Google recommends a budget large enough to gather conversion data, not a hard-floor figure |
| Promotions, product ratings, Local Inventory Ads | $0 to enroll (free local listings in ~45 countries; paid LIA in 80+ countries; promotions setup free) | Separate enrollment via Settings → Add-ons; LIA requires local product feed and Google Business Profile link |
Sources: Google, “Merchant Center is a free tool”; Google, “About free listings” (free listings enabled by default, no Google Ads account required); smec Shopping Ads Benchmark (Jun 2026, €650M EU ad spend, Standard Shopping €0.38 / PMax €0.40); AdBacklog, “Google Shopping Ads Benchmarks Per Industry (2025)” (global Standard Shopping, Apr 2025, methodology not disclosed). Not mbadv client data.
MB Adv Agency frames the cost question this way for every Shopping merchant: Merchant Center is the free catalog layer; Google Ads is where spend begins. To understand the full set of free and paid surfaces your feed can power, see Google Merchant Center programs. For the two-tool architecture that explains why the catalog is free while the ads are not, see Merchant Center vs Google Ads: key differences.
Why Google Merchant Center Has No Price Tag
The most common misconception behind the search query “Google Merchant Center pricing” is that Merchant Center has a cost structure to decode. It does not. Merchant Center Next is a free Google tool — the account, the product catalog, and the free product listings that run across Google Search, Shopping, Images, Lens, YouTube, Maps, and AI surfaces all carry a cost of $0. A merchant who creates a Merchant Center account, submits a complete product data source, and enables free listings has spent nothing. That is the full “Merchant Center pricing” story: there is no tier, no subscription, and no per-listing fee.
The cost question only becomes a number question when a merchant links Merchant Center to a Google Ads account and launches paid Shopping campaigns. At that point, the cost is entirely determined by the CPC model: you pay per click on a paid Shopping or Performance Max ad, on a daily budget you set and can change at any time. There is no Google-published minimum spend for Performance Max — Google’s guidance is to set a budget large enough to collect conversion data, not a specific dollar floor. Linking Merchant Center with Google Ads is the step that opens the paid-Shopping layer; without it, free listings run at $0.
Free product listings and paid Shopping ads draw from the same Merchant Center data source (the feed). Neither uses keywords — Google matches products to queries from the feed. The difference between them is placement, priority, and whether a click costs you anything. Free listings land in organic Shopping positions with no bid controls and no guaranteed placement; paid Shopping ads win the premium paid slots through the auction. Running both in parallel is the standard approach: free listings as the zero-cost baseline, paid Shopping for the volume and placement control that the free layer cannot deliver. The distinction is covered in full in the billing-model decoder in the next section.
What Merchants Search For: The Cost and CPC Cluster
“Google shopping ads cost” is the highest-volume term in this cluster at 150 US monthly searches (Ahrefs, June 2026, KD 2), followed by “is google merchant center free” at 60/month (KD 12). The existing URL already holds 872 GSC impressions across 73 keywords in the 90-day window, with “google merchant center pricing” as the top toehold (position 11.9). These search patterns confirm that most merchants arrive with two sequential questions: first, “does Merchant Center cost anything?” and then, “what will I actually pay for Shopping ads?” This pillar answers both.
| Keyword | US monthly vol. | Global vol. | KD | Notes / GSC footprint |
|---|---|---|---|---|
| google shopping ads cost | 150 | 200 | 2 | Highest-volume term; Shopping-specific cost intent |
| is google merchant center free | 60 | 150 | 12 | Binary yes/no intent — answer above the fold |
| google merchant center pricing ★ | 30 | 40 | — | ★ TOEHOLD — 872 GSC impressions, position 11.9; top keyword protecting this upgrade-in-place |
| google shopping cpc | 10 | 50 | — | Shopping-specific benchmark intent; smec + AdBacklog are the named sources |
| how much does google merchant center cost | 0 | 0 | — | The head-term slug; the cost-answer H2 carries this exact id for deep-linking |
Sources: Ahrefs keywords-explorer-overview, US, June 2026 (data JSON, primary_keywords array; US monthly volume); Google Search Console, mbadv property, 90-day window April 1–June 30, 2026 (872 impressions, 1 click, position 11.94, 73 keywords for the existing how-much-does-google-merchant-center-cost URL).
The 872 GSC impressions across 73 keywords confirm that the toehold “google merchant center pricing” already pulls traffic to this URL. The intent layering is clear: readers start with a yes/no cost question, then move to the Shopping CPC benchmark question once they know Merchant Center is free. For an overview of Merchant Center before the cost section, see overview of Google Merchant Center.
Free Listings vs Shopping Ads vs Performance Max: The Billing-Model Decoder
Three Google Shopping surfaces run from the same Merchant Center feed — and only two of them cost anything. Understanding which surface triggers a cost and when is the prerequisite for any Shopping budget plan.
Free product listings are the organic layer. They run at $0, require no Google Ads account, and are enabled by default on new Merchant Center accounts (under Marketing → Marketing methods). They place in secondary, non-guaranteed positions, and Google determines placement algorithmically from the feed — no bidding, no bid controls, no guaranteed slot. Standard Shopping ads are the paid layer for premium placement: you set bids, pay per click, and win the top paid Shopping slots through the Google Ads auction. Performance Max campaigns run across all Google surfaces (Shopping, Search, Display, YouTube, Discover, Gmail, Maps) using Smart Bidding and the product feed; any campaign created from inside Merchant Center is a Performance Max campaign, as confirmed by Google’s Merchant Center help page. Standard Shopping campaigns must be created directly in Google Ads.
Run free listings as the always-on zero-cost baseline, then add paid Shopping or PMax for the volume and placement control the organic layer cannot provide. Free listings cost nothing regardless of how many clicks they receive.
| Surface / campaign type | Cost model | Requires Google Ads? | Placement priority |
|---|---|---|---|
| Free product listings (Shopping tab, Search, Images, Lens, YouTube, Maps, AI surfaces) | $0 — no cost per click, no cost per impression | No — Merchant Center only; enabled by default on new accounts | Organic / secondary positions; Google determines placement algorithmically; no bidding controls |
| Standard Shopping ads (created directly in Google Ads — not inside Merchant Center) | CPC — pay per click only; daily budget you set; manual CPC or Smart Bidding | Yes — linked Google Ads account required | Premium paid Shopping slots (top of Shopping results); eligible for top positions on Search |
| Performance Max (any campaign created inside Merchant Center = PMax) | CPC (+ impression-based on display/YouTube surfaces); Smart Bidding; daily budget you set; Google manages placement across all surfaces | Yes — linked Google Ads account required | All of Google (Shopping, Search, Display, YouTube, Discover, Gmail, Maps) — broader reach, less placement transparency than Standard Shopping |
| Local Inventory Ads (LIA) | CPC for paid LIA (80+ countries); free local listings in ~45 countries at no cost | Yes for paid LIA; no for free local listings | Local Shopping surfaces; shown to nearby shoppers; requires local product feed + Google Business Profile link |
Sources: Google, “About free listings” (free listings = $0, enabled by default, no Google Ads required); Google, “Create a Performance Max campaign in Merchant Center” (any campaign created from inside MC = PMax; Standard Shopping must be created in Google Ads); Google Merchant Center Help (LIA: 80+ countries paid, ~45 free local listings). Not mbadv client data.
The clearest way to think about the split: free listings need only Merchant Center; Shopping ads and PMax need both Merchant Center and an active Google Ads account with a budget. Best practices for optimizing product feeds covers the feed quality work that improves performance on both the free and paid layers, and our Google Shopping feed management service handles the data-source work that keeps listings eligible and CPCs efficient.
Google Shopping CPC by Product Industry: AdBacklog Global Benchmarks (2025)
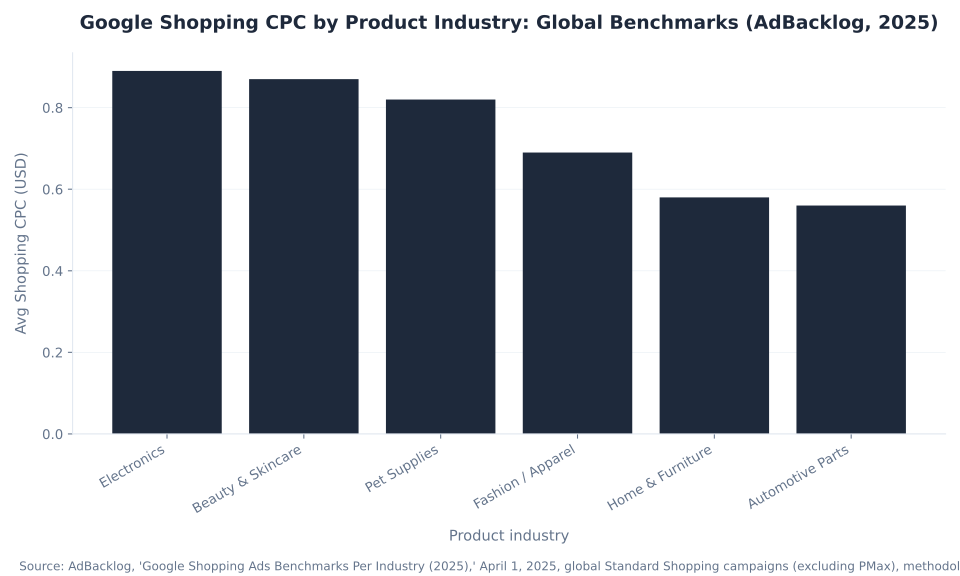
Industry is the single biggest structural driver of your Google Shopping CPC. AdBacklog’s April 2025 benchmark — covering global Standard Shopping campaigns, methodology not fully disclosed — shows a ~60% spread between the cheapest and most expensive verticals. Use this table directionally for relative industry comparisons, not as a precise absolute benchmark.
Important correction from web-verification: The AdBacklog page covers global benchmarks for Standard Shopping campaigns (excluding Performance Max and Smart Shopping), not US-specific figures as sometimes described. The figures below are global; US CPCs for the same verticals can differ based on auction dynamics and competition density. Present these as the directional industry ordering — Electronics and Beauty at the high end, Automotive at the low end — and locate your category within the $0.56–$0.89 range before budgeting. For high-competition verticals like Electronics, see electronics PPC management; for Beauty, see beauty products PPC.
| Product vertical | Avg Shopping CPC (global, 2025) | Directional note |
|---|---|---|
| Electronics | $0.89 | Highest in the AdBacklog set — high-competition, high-AOV; many brand advertisers |
| Beauty & Skincare | $0.87 | Highly competitive; brand and DTC overlap; repeat-purchase dynamic drives sustained competition |
| Pet Supplies | $0.82 | Loyal repeat-purchaser audience attracts concentrated advertiser competition |
| Fashion / Apparel | $0.69 | Broad category spread; brand apparel runs higher, basics run lower — see fashion PPC |
| Home & Furniture | $0.58 | Lower competition density in many sub-categories; seasonal peaks drive up CPC |
| Automotive Parts & Accessories | $0.56 | Lowest in the set — specialized queries, fewer advertisers per SKU, higher-consideration purchase |
| ★ Cross-vertical global spread | ~$0.56 → $0.89 | The ~60% gap between Automotive and Electronics is the first input to any Shopping budget plan; a blended average hides this spread entirely |
Source: AdBacklog, “Google Shopping Ads Benchmarks Per Industry (2025)” (April 1, 2025; global Standard Shopping campaigns, excluding PMax and Smart Shopping; methodology — sample size, collection method, and time period — not publicly disclosed; use directionally for relative industry comparisons). CORRECTION from brief: web-verification confirmed these are global figures, not US-specific. Also see pet supplies PPC. Not mbadv client data.
The industry ordering is the durable insight: Electronics and Beauty at the high end (~$0.87–$0.89), Automotive and Home at the low end (~$0.56–$0.58). The exact dollar per vertical shifts with vendor, market, and period; the ordering is the planning anchor. Feed quality — precise titles, correct GTINs, complete attributes — is one lever the merchant controls directly: Google attributes a 20% increase in clicks on average to products with correct GTINs. See best practices for optimizing product feeds for the title, image, and attribute work that moves your cost-efficiency.
Google Shopping CPC Benchmarks by Named Vendor: smec, AdBacklog, and the WordStream Exclusion
The most important source-discipline rule in Google Shopping cost research: the widely circulated “average Google Ads CPC” figures from WordStream and LocaliQ — $5.26 (2025) and $5.42 (2026) — are Google and Microsoft Ads Search campaign benchmarks only. They cover keyword-targeted text ads on search results pages. They contain no Google Shopping CPC data. Applying $5.42 to a Shopping budget would overstate expected Shopping CPC by roughly 7–14× vs the current Shopping-specific figures. The Shopping-specific, named-source benchmarks are smec (European) and AdBacklog (global, methodology caveat).
MB Adv Agency keeps Shopping cost benchmarks Shopping-specific: smec’s live European dashboard (last updated June 29, 2026) is the strongest current named source with disclosed dataset scope (€650M in European ad spend, 8 ecommerce verticals). smec puts the Standard Shopping median at €0.38 and Performance Max at €0.40 — a ~5% PMax premium reflecting its broader surface coverage. AdBacklog’s April 2025 global benchmark adds the industry-level spread ($0.56–$0.89) but without disclosed methodology. Neither provides a US-specific figure with transparent methodology — the correct editorial stance for US merchants is a directional range, not a synthesized single headline CPC.
| Figure / CPC estimate | Vendor | Period / dataset | Status / caveat |
|---|---|---|---|
| Standard Shopping median ~€0.38 | smec | Jun 2026; €650M EU ad spend; 8 Shopping verticals; European markets | ✅ Current, Shopping-specific, disclosed dataset scope. European only (€). Best current named-source figure. US CPCs can differ. |
| PMax median ~€0.40 | smec | Jun 2026; same dataset; European | ✅ Current, Shopping-specific. ~5% above Standard Shopping median in this dataset; PMax competes across more Google surfaces. |
| Global avg* ~$0.74 (calculated) | AdBacklog | Apr 2025; global Standard Shopping; methodology not disclosed | ✅ Use directionally for industry ordering. *$0.74 is a calculated midpoint across 6 verticals — not a published AdBacklog figure. Methodology not disclosed. |
| Shopping 2019 avg $0.66 | WordStream | Aug 2018–Feb 2019 data; US Shopping (stale) | ⚠ STALE — 6+ years old; not updated since. Cited here only as the stale-benchmark exclusion. Do not use as a current Shopping CPC. |
| ★ “Average Google Ads CPC” $5.26 (2025) / $5.42 (2026) — NOT a Shopping CPC. Do not cite for Shopping. | WordStream / LocaliQ | Annual; Google + Microsoft Ads Search campaigns only | ❌ WRONG CHANNEL — Search-only; keyword-targeted text ads on search results pages. Applying this to Shopping overstates Shopping CPC by ~7–14× vs smec and AdBacklog figures. Never cite for Shopping. |
Sources: smec, “Google Ads CPC Benchmarks for European Ecommerce” (live dashboard, Jun 29, 2026; €650M EU ad spend, 8 verticals; Standard Shopping €0.38, PMax €0.40) [verify URL at publish]; AdBacklog, “Google Shopping Ads Benchmarks Per Industry (2025)” (Apr 1, 2025; global; methodology not disclosed; $0.74 = calculated midpoint, not a published figure); WordStream/LocaliQ Google Ads Benchmarks (cited only as the Shopping-exclusion: Search-only; their only Shopping figure is the stale 2019 $0.66). Not mbadv client data.
The takeaway from Table 5: all Shopping-specific figures from named sources cluster in the €0.38–$0.89 range. The $5.42 Search CPC is a different auction, a different ad format, and a different price level. The merchant who plans a Shopping budget using $5.42 is solving for the wrong channel. For end-to-end ecommerce PPC strategy across Shopping, PMax, and budget allocation, see our ecommerce PPC agency services.
What Drives Your Google Shopping CPC Up or Down
Your Google Shopping CPC is not a single number — it is the product of your industry, your bid strategy, your feed quality, and your query mix. The merchant asking “is my CPC reasonable?” needs to locate it on all of these axes, not compare it to a blended average. Table 6 decodes the main levers in order of typical impact.
The industry spread alone is a ~60% gap (Table 4). Beyond category, the biggest controllable lever is feed quality: Google attributes a 20% increase in clicks on average to products with correct GTINs, and a richer feed (precise titles, complete attributes, high-resolution images) improves auction eligibility. Bid strategy adds another layer — a lower CPC on a keyword that does not convert is no advantage. The goal is the lowest CPC per sale, not the lowest CPC per click.
| Lever | How it moves your Shopping CPC |
|---|---|
| Industry / product vertical | Biggest structural driver. Electronics / Beauty / Pet Supplies run ~$0.82–$0.89 global; Automotive / Home run ~$0.56–$0.58. Locate your vertical before budgeting (Table 4; AdBacklog global 2025). |
| Auction competition | More advertisers on the same product type or query raises CPC through the second-price auction. Seasonal peaks (Q4 holiday, back-to-school) and niche verticals face very different competition levels — long-tail and niche SKUs typically face lighter competition. |
| Campaign type: Standard Shopping vs Performance Max | PMax CPCs run slightly above Standard Shopping on average (smec Jun 2026: ~€0.40 vs ~€0.38, a ~5% premium) because PMax competes across more Google surfaces. PMax also requires Smart Bidding, which optimizes for conversion value, not raw CPC. |
| Bid strategy | Manual CPC gives direct cost control; Smart Bidding strategies (Maximize Clicks, Target ROAS, Maximize Conversion Value) trade CPC control for conversion-outcome optimization. A low CPC is only an advantage if it converts at a profitable rate. |
| Feed quality and GTIN completeness | A richer, accurate product feed improves Google’s ability to match products to relevant queries, improving auction eligibility. Google attributes a 20% increase in clicks on average to products with correct GTINs. A thin feed leaves reach and efficiency on the table. |
| Geography | CPCs vary by market. smec’s European benchmarks (~€0.38) reflect European auction dynamics and are not directly comparable to global or US CPCs. AdBacklog’s global figures average across all geographies. Neither is a US-only headline. |
| Product price point / AOV | Higher-AOV products support higher CPCs while maintaining ROAS. Lower-AOV consumables and accessories need tighter CPC discipline to stay profitable. AOV is the denominator in the “maximum CPC I can afford” equation: max CPC = AOV × conversion rate × target margin. |
| Seasonality | Q4 (Oct–Dec) drives up competition and CPC in most consumer categories. Category-specific peaks (back-to-school for Apparel/Electronics; spring for Home/Garden) add vertical-specific surges. Plan budgets with seasonal multipliers, not a flat monthly figure. |
Sources: smec Jun 2026 (Standard Shopping vs PMax CPC comparison; European); AdBacklog Apr 2025 (industry CPC spread — Table 4); Google product data specification (GTIN “20% increase in clicks on average” — official Google stat). Cost-driver analysis is structural/directional; no single benchmark covers every combination of lever. Not mbadv client data.
Feed quality is the lever that sits between the merchant and the auction. A well-structured, complete feed with correct GTINs, precise product titles, and high-resolution images improves eligibility across both the free-listings and paid-Shopping layers. Our Google Shopping feed management service handles the data-source work that keeps both layers efficient.

Shopping Ad Budget and Bid Control: What You Actually Set
Once a merchant links Merchant Center to Google Ads and launches Shopping campaigns, three controls govern what they spend: the daily budget, the bid strategy, and — for Standard Shopping — the manual CPC bid or Smart Bidding target. Table 7 decodes each control and its cost implication.
The daily budget is set at the campaign level and is editable at any time. Google can spend up to 2× the daily figure on high-opportunity days, within a monthly cap equal to the daily budget × 30.4. There is no Google-published hard minimum daily budget for Performance Max — Google’s documented guidance is to set a budget of “at least 3× your target CPA” per day to give Smart Bidding enough signal; the commonly cited practitioner starting floor of $50–$100/day is industry heuristic, not an official Google figure. See Google Ads Help, “Choose your bid and budget” for the current guidance. For the step-by-step budget estimation process, see the Merchant Center performance dashboard and the HowTo section below.
| Control | Detail | Source |
|---|---|---|
| Daily budget | Set at campaign level; editable at any time. Google can spend up to 2× on high-opportunity days within the monthly cap (daily × 30.4). Standard Shopping and PMax both use daily budgets. | Google Ads Help |
| PMax minimum budget | No Google-published hard floor. Google recommends “at least 3× your target CPA” per day. The $50–$100/day figure cited by practitioners is a heuristic, not an official minimum. | Google Ads Help (no floor stated) |
| Standard Shopping bid: manual CPC | Direct cost control at the product group or campaign level. You set the max CPC; Google charges the clearing price in the second-price auction (not the full max bid). | Google Ads Help; Standard Shopping campaigns created directly in Google Ads |
| Standard Shopping bid: Smart Bidding | Maximize Clicks, Target ROAS, Maximize Conversion Value — Google manages bids to hit the conversion outcome. Trade raw CPC control for conversion-outcome optimization. | Google Ads Help |
| Performance Max bid control | Smart Bidding only (Maximize Conversion Value by default). No manual CPC option. Google allocates across all surfaces; PMax requires Smart Bidding from launch. | Google Merchant Center Help (PMax created from inside MC) |
| Free listings billing | $0. No clicks charged on free listings, no budget required. No Google Ads account needed. Free listings run alongside paid Shopping from the same feed — separate surfaces, no overlap in billing. | Google, “About free listings” |
| Monthly spend cap formula | Daily budget × 30.4 = monthly cap. A $50/day budget spends at most $1,520/month. Google distributes spend across days; you are not charged more than the monthly cap. | Google Ads Help |
Sources: Google Ads Help, “Choose your bid and budget” (CPC billing; daily budget; monthly cap = daily × 30.4; no published PMax hard minimum); Google Merchant Center Help, “Create a Performance Max campaign” (PMax Smart Bidding only; created from inside MC); Google, “About free listings” (free listings = $0, no budget required). Not mbadv client data.
Budget control and bid strategy are where the cost theory meets the daily account reality. For a full ecommerce PPC audit that finds where the budget goes and what structural changes bring CPC down, see our Google Ads PPC audit. For ongoing campaign management across Shopping and PMax, see PPC campaign management.
The One Source Rule That Prevents the Most Common Shopping Cost Mistake
The number that most frequently misleads merchants researching Google Shopping costs is the WordStream / LocaliQ average Google Ads CPC — $5.26 (2025) and $5.42 (2026). This figure appears prominently in industry benchmarking roundups, and it is exclusively a Google and Microsoft Ads Search campaign average. It has no bearing on Shopping CPC.
WordStream and LocaliQ’s annual Google Ads benchmark reports explicitly scope to keyword-targeted Search ads on search results pages. Their only Shopping-specific figure is a 2019 benchmark ($0.66 average CPC, data covering August 2018–February 2019) that has not been updated in over six years — it predates Performance Max, the Shopping Graph rebuild, and six years of auction evolution. Applying $5.26 or $5.42 to a Google Shopping budget would overstate expected CPC by roughly 7–14× vs the smec and AdBacklog Shopping-specific figures for the same period. The source-discipline table below shows the full picture.
| Source | Figure | Scope | Use for Shopping? |
|---|---|---|---|
| smec — Standard Shopping | €0.38 | European Shopping, €650M spend, Jun 2026 | ✅ Yes — Shopping-specific, current, disclosed dataset scope |
| smec — Performance Max | €0.40 | European Shopping, same dataset, Jun 2026 | ✅ Yes — Shopping-specific, current |
| AdBacklog — global avg (calculated) | ~$0.74 | Global Standard Shopping, Apr 2025; methodology not disclosed | ✅ Directionally yes — Shopping-specific; methodology caveat applies; use for industry ordering, not precise figures |
| WordStream — Shopping 2019 | $0.66 | US Shopping, Aug 2018–Feb 2019 (stale) | ⚠ No — Shopping-specific but 6+ years stale; cited here only as the historical exclusion reference |
| WordStream / LocaliQ — 2026 headline | $5.42 | Google + Microsoft Ads Search only; keyword-targeted text ads | ❌ Never — wrong channel, wrong auction format; applying this to Shopping overstates CPC by ~7–14× |
Sources: smec Jun 2026 (✅); AdBacklog Apr 2025 (✅ with caveat); WordStream/LocaliQ Google Ads Benchmarks (cited ONLY as the Shopping-exclusion; their current headline $5.42 = Search-only; Shopping figure = 2019 stale). All Shopping-specific sources cluster €0.38–$0.89; the $5.42 Search CPC is a different auction entirely. Not mbadv client data.
The source discipline is the differentiating point of this pillar: a Shopping budget built from a Search CPC benchmark is not a Shopping budget, it is a Search budget applied to the wrong channel. The Shopping-specific, current sources are smec (European, Jun 2026) and AdBacklog (global, Apr 2025, methodology caveat). For accounts where the Shopping CPC feels high and the cause is unclear, an ecommerce PPC audit finds the structural issues driving up cost.
Google Shopping Channel Growth: Tinuiti Benchmark Data and Shopping Graph Scale
Two data streams set the broader channel context for any Shopping cost conversation: Tinuiti’s quarterly Shopping spend growth data and Google’s own Shopping Graph scale figures. Both confirm that Google Shopping is a growing, competitive channel — not a saturating one.
Tinuiti’s quarterly Digital Ads Benchmark Reports track year-over-year Shopping spend growth across their advertiser base. Spend growth held in the +14–18% YoY range across Q2 2025, Q3 2025, and Q1 2026, while Shopping CPC growth remained flat-to-down 1% YoY in the same windows — a stable cost environment despite rising spend. The Q1 2026 Tinuiti report adds a PMax-specific finding: Performance Max accounted for 67% of Google Shopping spend and 68% of Shopping sales among advertisers running both PMax and Standard Shopping, with PMax slightly outperforming Standard Shopping in ROAS. On the catalog scale side, Sundar Pichai cited 50 billion product listings in the Shopping Graph at the NRF 2026 keynote (January 11, 2026), up from 45 billion in October 2024, with 2 billion listings refreshed every hour. A merchant’s free product listings enter a catalog of that scale — feed quality and completeness determine where they surface.
| Quarter | Shopping spend YoY growth | Shopping click YoY growth | CPC trend |
|---|---|---|---|
| Q2 2025 | +18% | +18% | +1% (modest) |
| Q3 2025 | +14% | +15% | -1% (down) |
| Q1 2026 | +18% | +18% | Flat |
Source: Tinuiti, “Digital Ads Benchmark Reports” — Q2 2025, Q3 2025, Q1 2026 (YoY growth in Google Shopping spend and clicks across Tinuiti advertiser base; absolute spend not published). Q4 2025 omitted (not extracted from available public summaries). Additional Q1 2026 finding: PMax = 67% of Shopping spend / 68% of Shopping sales among dual-format advertisers. Shopping Graph scale: Google Blog, Oct 2024 (45 billion listings); Sundar Pichai NRF 2026 keynote (50 billion listings; 2 billion refreshed hourly). Not mbadv client data.
The combination of +14–18% spend growth with flat-to-declining CPC growth (per Tinuiti Q2 2025–Q1 2026, corroborated by smec’s deceleration in European CPC inflation from +16% YoY in Q3 2025 to +6% YoY in Q2 2026) indicates a channel expanding in volume without proportional CPC escalation. Merchants entering Shopping now are entering a growing, competitive channel with stable cost per click — a favorable entry condition. For performance tracking once Shopping campaigns are live, see the Merchant Center performance dashboard.
How to Estimate Your Google Shopping Ad Spend: The Right Starting Point
Estimating Google Shopping cost starts with the right number — which is a Shopping CPC from a Shopping-specific source, not a Search CPC from a Search benchmark report. With that anchored, the estimate follows a straightforward sequence: industry CPC range from the table above, adjusted for your product AOV and target ROAS, converted into a daily budget that gives Smart Bidding or manual CPC enough traffic to optimize.
Start with your product vertical. From Table 4 (AdBacklog global 2025, directional), Electronics and Beauty run around $0.87–$0.89 globally; Automotive and Home run around $0.56–$0.58. Locate your category in that range as the CPC input. Then confirm your AOV: the maximum CPC you can afford while maintaining your target ROAS is AOV × conversion rate × target margin. A $50 AOV product with a 3% conversion rate and 30% margin yields a max CPC of $0.45 — below the global average, which is why AOV and margin are the second and third inputs after category. Finally, set a daily budget large enough for Smart Bidding to learn — Google’s guidance is at least 3× your target CPA per day; practitioners commonly use $50–$100/day as a learning-phase starting point, not an official minimum.
MB Adv Agency runs this estimate-then-optimize loop at the start of every Shopping engagement: size the expected CPC from the named-source ranges, set the daily budget to the conversion-data threshold, then let the first 30 days of data redirect spend toward the keywords, products, and geographies with the best cost-per-sale. The HowTo steps below formalize this process, and our Google Shopping feed management service handles the feed-quality work that lowers the effective CPC at the auction level. For a full ecommerce PPC strategy across Shopping, PMax, and Search, see ecommerce PPC agency services.

Control Your Google Shopping Cost
Feed quality is the CPC lever you control directly — and the one most merchants underuse
A complete, accurate feed with correct GTINs and precise product titles improves auction eligibility on both free listings and paid Shopping. Our team handles the data-source work that keeps CPCs efficient and listings live.
Google Shopping feed management →Performance Max Cost vs Standard Shopping Cost: What the smec Data Shows
The PMax-vs-Standard-Shopping cost comparison is critical for any Q1 2026 budget plan: Performance Max accounted for 67% of Shopping spend among Tinuiti’s dual-format advertisers. smec’s June 2026 European data gives the clearest benchmark: PMax CPCs around €0.40 vs Standard Shopping ~€0.38 — a ~5% premium.
The PMax premium is structural: Performance Max competes across all of Google (Shopping, Search, Display, YouTube, Discover, Gmail, Maps) rather than Shopping placements alone, which extends reach but also raises the effective CPC because the auction draws from a broader set of surfaces. PMax also requires Smart Bidding from launch — there is no manual CPC option — so the bid strategy is optimized for conversion value, not the lowest possible click price. Standard Shopping supports manual CPC, giving direct cost control at the product-group level.
The Q1 2026 Tinuiti finding (PMax slightly outperforming Standard Shopping in ROAS among dual-format advertisers) is consistent with the cost picture: PMax costs a bit more per click but also converts at a slightly better rate, producing a comparable or better cost-per-sale in that dataset. For merchants choosing between the two: Standard Shopping is the right starting point when you need placement transparency and CPC control; PMax is the right scale vehicle once you have conversion history and want cross-surface reach. Linking Merchant Center with Google Ads is the prerequisite for either; the PMax distinction (campaigns created from inside Merchant Center) is confirmed at Google’s Merchant Center help page. For PMax and Shopping budget allocation decisions, see our PPC services.
How to Estimate and Budget Your Google Shopping Ad Spend
Controlling Google Shopping cost is a sequence: confirm the free baseline, locate your expected CPC in your vertical, set bids and a daily budget to your conversion economics, then let the data redirect spend.
- Confirm that Merchant Center is free — no cost until you link Google Ads and launch campaigns. Free product listings run at $0 and are the always-on zero-cost baseline. Enable them under Marketing → Marketing methods. No Google Ads account required. Every penny you invest in feed quality improves free-listings performance at no additional cost.
- Identify your product vertical and locate your expected CPC range in the industry table. Use Table 4 (AdBacklog global 2025, directional) as the starting range: Electronics and Beauty around $0.87–$0.89 globally; Automotive and Home around $0.56–$0.58. The ~60% spread means the blended average is almost never your number — locate your vertical before setting a budget.
- Decide between Standard Shopping and Performance Max. Standard Shopping gives manual CPC control and Shopping-only placement. Performance Max uses Smart Bidding across all Google surfaces, runs around 5% higher CPC in the current smec data (€0.40 vs €0.38), and requires conversion history to optimize well. Start with Standard Shopping for transparency and control; add PMax once you have conversion data and want cross-surface scale.
- Confirm your AOV and target ROAS to calculate the maximum CPC you can afford. The formula: max CPC = AOV × conversion rate × target margin. A $50 AOV product, 3% conversion rate, and 30% margin yields a max CPC of $0.45. Your CPC target is set by your conversion economics, not by a benchmark average.
- Set a daily budget large enough to gather conversion data. Google’s guidance: at least 3× your target CPA per day to give Smart Bidding enough signal. There is no Google-published hard minimum for Performance Max. Fund a daily budget you can sustain for 30–60 days; the monthly cap is daily × 30.4.
- Enable free product listings as the always-on zero-cost baseline alongside paid Shopping. Both layers use the same Merchant Center data source. Free listings cost nothing and run in organic Shopping positions. Running both in parallel maximizes your Google Shopping presence — paid for premium placement, free for organic reach. See Google Merchant Center programs for the full set of surfaces your feed can power.
- Improve feed quality to lower effective Shopping CPC. A richer, accurate feed with correct GTINs, precise titles, complete attributes, and high-resolution images improves auction eligibility. Google attributes a 20% increase in clicks on average to products with correct GTINs. Feed quality is the lever the merchant controls directly. See best practices for optimizing product feeds for title, image, and attribute improvements that move cost-efficiency.
MB Adv Agency runs this loop before scaling any Shopping account — locate the expected CPC in the right vertical, set the daily budget to the conversion-data threshold, and let the first 30 days of data redirect spend toward the products and geographies with the best cost-per-sale. To pressure-test a budget against real conversion economics, our Google Shopping feed management service is the starting point for the feed-quality work that lowers effective CPC.
Google Merchant Center Cost FAQ
Shopping CPC Creeping Up?
A structural fix is usually faster than bid adjustments
Shopping CPC problems often trace to feed quality, campaign structure, or a PMax eating Standard Shopping budgets. Our team finds the structural issue — and builds a plan that brings CPC back in line without cutting reach.
Ecommerce PPC agency →All PPC servicesMethodology
This pillar is an upgrade-in-place of the existing how-much-does-google-merchant-center-cost URL (872 GSC impressions across 73 keywords in the 90-day window ending June 30, 2026; top toehold keyword: “google merchant center pricing,” position 11.9). Every cost figure draws from a named Shopping-specific vendor or Google primary documentation, verified June 30, 2026: Google, “Merchant Center is a free tool” (account and free listings = $0); Google, “About free listings” (free listings enabled by default, no Google Ads required); smec, “Google Ads CPC Benchmarks for European Ecommerce” (live dashboard, last updated June 29, 2026; €650M EU ad spend; Standard Shopping €0.38, PMax €0.40; 8 verticals); AdBacklog, “Google Shopping Ads Benchmarks Per Industry (2025)” (April 1, 2025; global Standard Shopping, excluding PMax; methodology not disclosed); Tinuiti Digital Ads Benchmark Reports (Q2 2025, Q3 2025, Q1 2026; YoY Shopping spend growth and PMax share); Google Shopping Graph scale (45 billion Oct 2024; 50 billion + 2 billion/hour updated, Jan 11, 2026). WordStream/LocaliQ is cited only as the Shopping-exclusion reference — their headline $5.42 (2026) covers Search only; their only Shopping figure is a stale 2019 $0.66 benchmark not updated in 6+ years. No mbadv client metrics appear anywhere in this pillar — all CPC figures are vendor-attributed and the agency point of view is qualitative. Search demand context from Ahrefs keyword data, US, June 2026. Reviewed by MB Adv Agency, June 2026.
Google Merchant Center is a vital tool for e-commerce businesses looking to enhance their online presence and drive sales through Google Shopping ads. However, as with any platform, there are costs associated with using Google Merchant Center that businesses need to be aware of. In this article, we'll explore the various costs involved, factors that can influence these expenses, and tips to manage costs effectively.
Overview of costs
The costs related to Google Merchant Center can be broken down into several key categories. Initially, it's important to recognize that Google Merchant Center itself is free to use. This means that setting up an account, adding your product listings, and managing your inventory does not incur any direct fees.
However, to effectively utilize Google Merchant Center, businesses often turn to Google Ads to promote their products. The costs associated with advertising on Google Ads can vary widely based on various factors such as bidding strategies, competition in your industry, and your advertising goals.
Additionally, if your business relies on third-party services to optimize your product feeds or create targeted ad campaigns, those services may come with their own fees, which can contribute to your overall expenditure. Thus, while Google Merchant Center itself is free, costs can accumulate quickly when you consider the entire ecosystem surrounding product advertising on Google.
Types of advertising costs
When utilizing Google Ads in conjunction with Google Merchant Center, there are several types of advertising costs that businesses should account for:
- Click Costs: This is the amount you pay each time a user clicks on your ad. The cost per click (CPC) can vary significantly, influenced by factors such as competition and your quality score.
- Impression Costs: While Google primarily uses a pay-per-click model, businesses can also pay for impressions, especially in display advertising.
- Cost per Acquisition (CPA): This metric helps businesses understand the overall cost of acquiring a customer through Google Ads, factoring in all advertising expenses associated with that acquisition.
- Monthly Budget: Businesses need to determine a monthly budget for their advertising efforts which helps to manage total costs.
Understanding these costs is vital for creating an effective advertising strategy and ensuring a positive return on investment. Moreover, businesses should also consider the potential for additional costs associated with maintaining a competitive edge in the marketplace. For instance, seasonal promotions or special events may require increased advertising spend to capture consumer interest during peak shopping times. This can lead to fluctuating budgets that need to be carefully monitored and adjusted as necessary.
Furthermore, it's essential to track the performance of your ads continuously. Utilizing tools such as Google Analytics can provide insights into customer behavior, helping businesses refine their advertising strategies over time. By analyzing metrics such as conversion rates and customer engagement, businesses can make informed decisions about where to allocate their advertising budget for maximum impact. This proactive approach not only helps in managing costs but also enhances the overall effectiveness of marketing campaigns.
Factors affecting expenses
Several key factors can influence the expenses associated with using Google Merchant Center and Google Ads:

- Competition: The more competition there is for a specific product or niche, the higher the costs for advertising. Businesses in saturated markets may find themselves paying more for clicks to maintain visibility. Additionally, understanding competitor strategies can provide insights into how to differentiate your offerings, potentially allowing for more effective ad placements that stand out amidst the noise.
- Quality of Product Listings: Highly optimized product data, including accurate descriptions, high-quality images, and relevant keywords can positively impact advertising costs. Google rewards well-optimized listings with lower cost per click rates. Furthermore, incorporating customer reviews and ratings can enhance credibility and improve click-through rates, ultimately leading to better ad performance.
- Bidding Strategy: Different bidding strategies such as manual CPC, enhanced CPC, or target CPA can significantly affect how much a business ends up spending. Each strategy comes with its unique benefits and costs. For instance, while manual CPC allows for more control over individual bids, automated strategies can optimize bids in real-time based on performance, potentially leading to more efficient spending.
- Targeting Options: The choice of demographics, geographical targeting, and device targeting can also impact costs. Ads targeting high-value customer segments may incur higher costs while offering better ROI. Moreover, utilizing remarketing strategies can help re-engage previous visitors, often at a lower cost, as these users are already familiar with the brand.
To successfully navigate these factors, businesses must regularly analyze their campaigns and adjust their strategies accordingly. This proactive approach helps maintain visibility without incurring unnecessary costs. Regularly testing different ad formats and messages can also uncover new opportunities for engagement and conversion, ensuring that marketing efforts remain fresh and relevant.
Monitoring your analytics
Tracking performance through analytics is essential for understanding how various factors impact costs. Google Analytics integrated with Google Ads can provide deeper insights into customer behavior, click-through rates, and conversion rates. This data allows businesses to fine-tune their advertising approach:
- Identify high-performing product categories.
- Assess the effectiveness of different ads and targeting strategies.
- Optimize bids based on performance data to ensure maximum return on investment.
By leveraging these analytics tools, businesses can make informed decisions that influence both their advertising spend and overall profitability. Additionally, setting up conversion tracking can help businesses understand which ads lead to actual sales, allowing for more strategic allocation of budgets toward the most effective campaigns. Regularly reviewing these metrics not only aids in cost management but also fosters a culture of continuous improvement, where data-driven insights lead to smarter, more impactful marketing strategies.
Tips for cost management
To successfully manage the costs associated with Google Merchant Center and Google Ads, implementing a few strategic practices can pay dividends:
Set a clear budget
Establishing a clear budget allows businesses to control their spending and set realistic expectations for advertising performance. Regularly reviewing and adjusting this budget based on performance data ensures that resources are allocated effectively. Furthermore, it’s beneficial to segment your budget by campaign type or product category, as this can provide deeper insights into which areas are yielding the best return on investment. This segmentation can help you identify high-performing products that may warrant increased funding while also spotlighting underperforming areas that may need reevaluation or adjustment.
Focus on product feed optimization
Optimizing product feeds is crucial. Adhere to best practices for product titles, descriptions, and images. Accurate and appealing product listings can enhance click-through rates, lowering the overall cost per click for your ads. Additionally, consider implementing structured data markup on your website. This not only improves the visibility of your products in search results but also helps Google better understand your offerings, potentially leading to improved ad placements and lower costs. Regularly updating your product feed to reflect inventory changes and seasonal trends can also keep your listings fresh and relevant, further enhancing performance.
Experiment with bidding strategies
Test various bidding strategies to determine which one yields the best results for your business. Consider starting with less aggressive options and slowly moving to more automated strategies as your campaigns mature and data accumulates. For instance, utilizing a target return on ad spend (ROAS) strategy can help you maximize profitability by adjusting bids based on the expected return of each click. Monitoring the performance of these strategies closely will allow you to pivot quickly if certain tactics are not delivering the desired results, ensuring you remain agile in a competitive marketplace.
Utilize promotional campaigns
Google Merchant Center allows businesses to run promotional campaigns that can enhance visibility during critical sales seasons. Taking advantage of these promotions can drive traffic without significantly increasing costs, leading to a better return on investment. Additionally, consider integrating seasonal promotions with social media campaigns to amplify reach and engagement. By creating a cohesive marketing strategy that spans multiple platforms, you can attract a broader audience and encourage more conversions, all while keeping an eye on your budget.
Regularly review campaign performance
Finally, maintaining a habit of reviewing your campaign performance is essential. Look for trends, test new ad formats, and continually optimize to improve cost efficiency. This cycle of regular analysis and adjustment can help ensure that costs do not spiral out of control. Utilizing tools like Google Analytics can provide deeper insights into user behavior and conversion paths, allowing you to make informed decisions about future campaigns. Additionally, consider setting up automated reports to track key performance indicators (KPIs) regularly, ensuring that you stay informed about your campaigns' effectiveness without having to manually sift through data.
In conclusion, while using Google Merchant Center boasts a variety of benefits for e-commerce businesses, understanding its associated costs is paramount. With a strategic approach that considers the complexities of advertising expenses, businesses can leverage Google Merchant Center to meet their marketing objectives without overspending.

As a Google Ads expert, I bring proven expertise in optimizing advertising campaigns to maximize ROI.
I specialize in sharing advanced strategies and targeted tips to refine Google Ads campaign management.
Committed to staying ahead of the latest trends and algorithms, I ensure that my clients receive cutting-edge solutions.
My passion for digital marketing and my ability to interpret data for strategic insights enable me to offer high-level consulting that aims to exceed expectations.
Google Partner Agency
We're a certified Google Partner Agency, which means we don’t guess — we optimize withGoogle’s full toolkit and insider support.
Your campaigns get pro-level execution, backed by real expertise (not theory).

4.9 out of 5 from 670+ reviews on Fiverr.
That’s not luck, that’s performance.
Highly recommend Matteo to set up your server side tracking. He has a deep understanding of e-commerce tracking and will go above and beyond to make sure everything is set up correctly and working 100%. If you are scaling your store this set up is non-negotiable in my opinion and there isn't many people who have this much knowledge or put the effort in to get it right. Thanks again!
avorodesign.com
I can only recommend Matteo! He was very patient, professional and very knowledgeable about GA4, Consent Mode v2, and GDPR compliance. Communication was clear, and the setup was done professionally and efficiently. Highly recommend him for anyone needing reliable tracking implementation.

www.natureiki.life
Matteo shines in the realm of online professionals. His work is not only deep in data but also complemented by his proactive communication and cooperation, setting a new standard for freelancers. If you want someone who truly exceeds expectations, look no further. Highly recommended!

www.omanbeverlysmyth.com
Exceptional Service Beyond Expectations - Outstanding Service Impeccable depth, flawless delivery, and exceptional language fluency—this service exceeded all expectations. Highly recommended. Matteo truly ROCKS!!!

ium-paris.com
Top-notch, always highly value working with Matteo. An absolute Google Ads Genius. This is approximately the 8th time I have hired him and he's helped us get 6-7 ROAS. We are excited in continuing to improve our lead flow. Hire this guy if you need Google Ads help. Thanks Matteo!

www.dleeventgroup.com
I finally found the guy who can setup server side tracking and all the ecosystem properly. I definitely recommend Matteo. He is very responsive, kind and wants to dig into things. He configured GA4, Meta, Google Ads, Outbrain and google consent v2 with Cookiebot. Thanks Matteo.

inomega.fr
MB Adv delivered exceptional work with outstanding professionalism and lots of patience, taking time to see effects of changes made and not just do the work and submit it. The proactive communication and video summaries of the work completed made working with Matteo a pleasure, as he consistently went above and beyond. Highly recommended for web analytics projects! We are already working on another project.

www.withnellsensors.co.uk
Working with Matteo on my Google Ads was a game-changer. He's not just a strategist, he's a true partner. He understood my goals and tailored a campaign that perfectly reached my target audience. I'm grateful for his expertise and dedication.
dccargo.com
Click-driven mind
with plastic-brick obsession.
We build Google Ads campaigns with the same mindset we use to build tiny brick worlds: strategy, patience, and zero tolerance for wasted pieces.
Data is our blueprint. Growth is the only acceptable outcome.