Core Web Vitals Report in Google Search Console 2026
48%
of mobile web origins pass all three Core Web Vitals simultaneously — Largest Contentful Paint, Interaction to Next Paint, and Cumulative Layout Shift. The majority of the mobile web is still failing at least one Google page-experience signal that influences Search ranking.
Source: 2025 Web Almanac, Performance chapter (HTTP Archive + CrUX, July 2025). almanac.httparchive.org/en/2025/performance
What Is the Core Web Vitals Report in Google Search Console?
The Core Web Vitals report in Google Search Console is the diagnostic surface that shows how your site's URLs perform on Google's three real-user performance metrics — Largest Contentful Paint, Interaction to Next Paint, and Cumulative Layout Shift — and classifies each URL group as Good, Needs Improvement, or Poor based on data from real Chrome user sessions. It lives under Experience > Core Web Vitals in the GSC left sidebar. The standalone Page Experience report that previously grouped it was removed from GSC in 2024; the Core Web Vitals report itself remains fully active and is the correct destination for CWV diagnostics. For a full orientation to GSC's interface and capabilities, see What is Google Search Console.
The report separates Mobile and Desktop into two tabs. Each tab classifies URL groups — not individual URLs — into the three status buckets. A URL group is a cluster of similar URLs (e.g., all blog posts on the same template) that GSC aggregates for statistical reliability. The "Examples" tab within each URL group lists specific representative URLs you can test in PageSpeed Insights. Within the Performance Report, clicks and impressions tell you which queries bring traffic; the Core Web Vitals report tells you whether those landing pages deliver a fast, stable, responsive experience to the users who arrive.
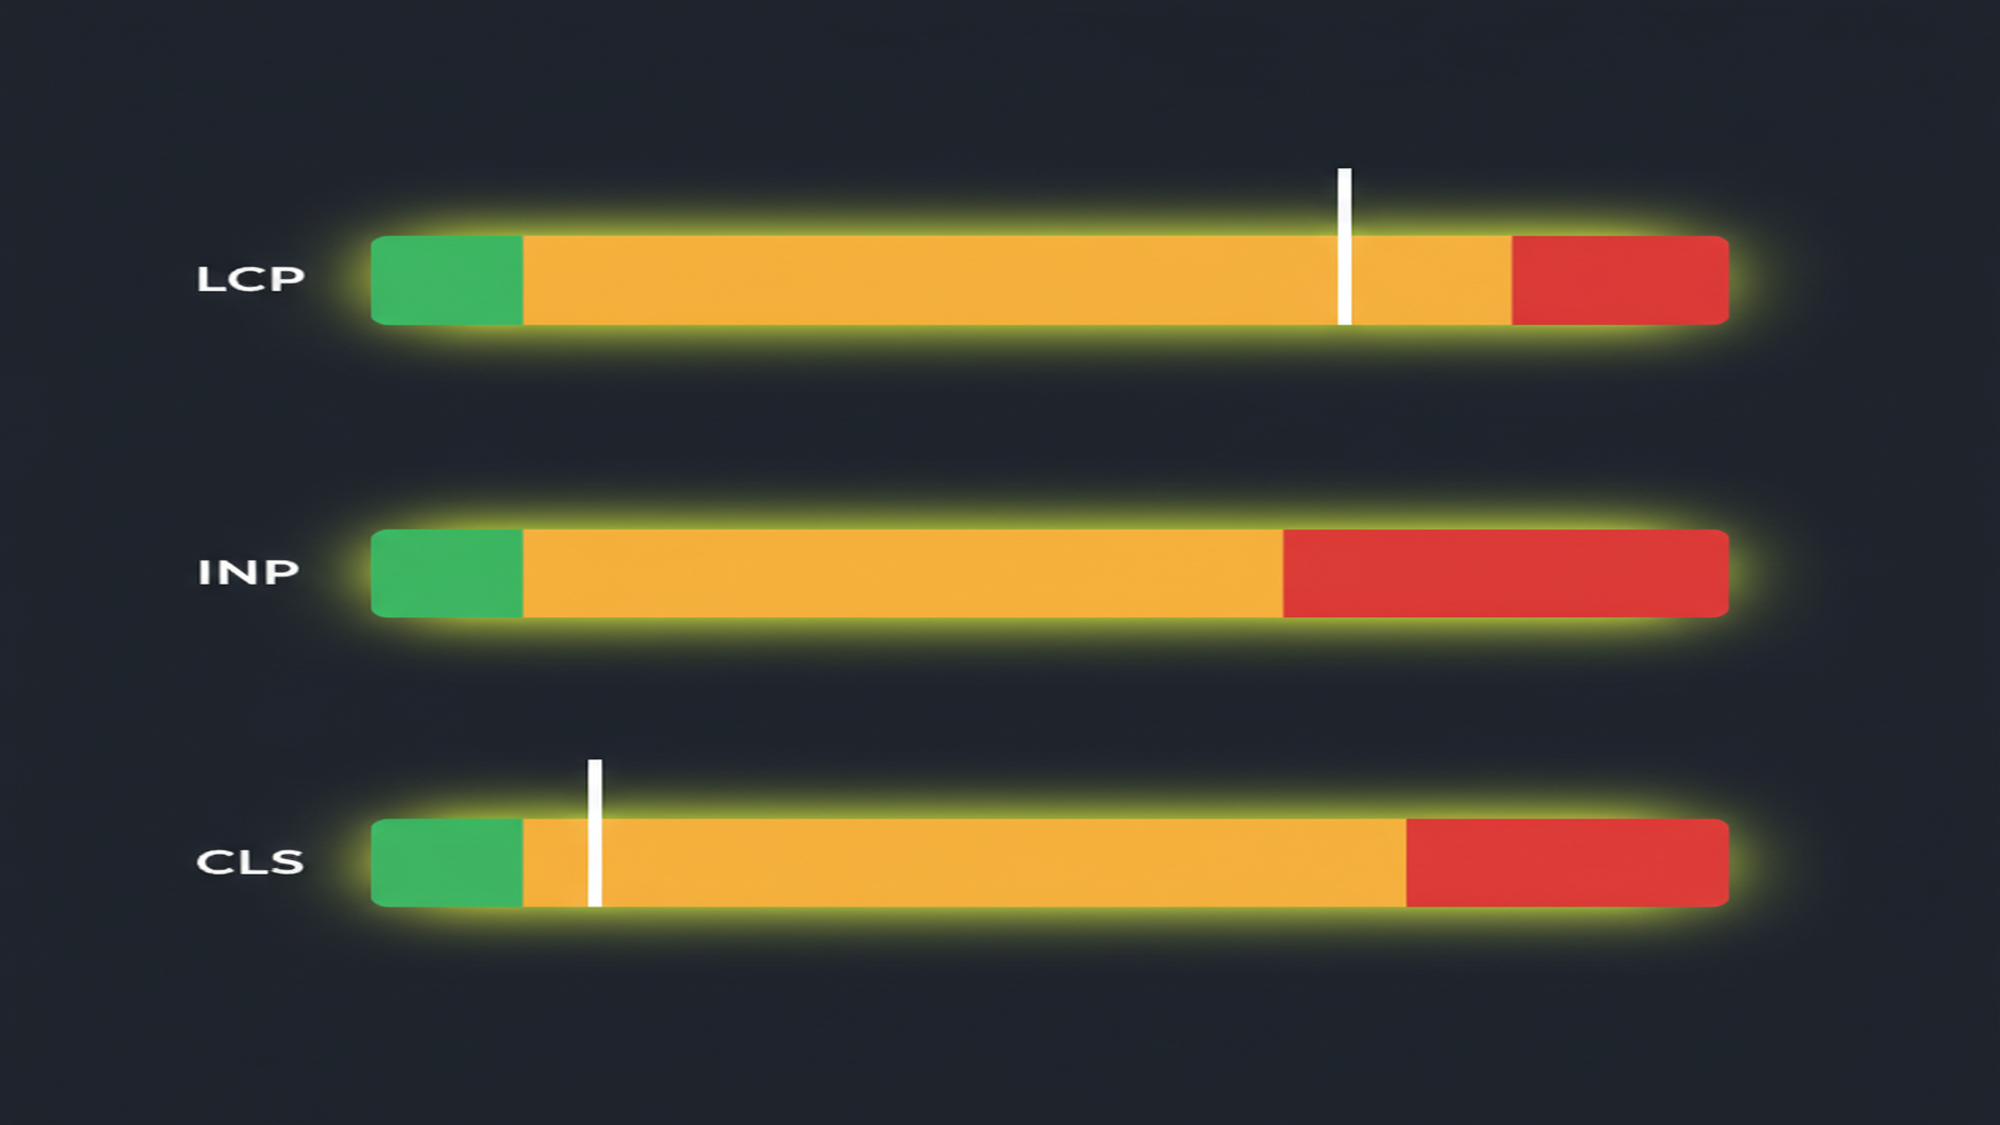
Three metrics define Core Web Vitals as of June 2026: Largest Contentful Paint (LCP) measures loading performance — the time from navigation start until the largest visible content element (an image or text block) is rendered. Interaction to Next Paint (INP) measures overall responsiveness — the near-worst-case latency of click, tap, and keyboard interactions throughout a full page visit. Cumulative Layout Shift (CLS) measures visual stability — how much page content shifts unexpectedly during load and lifespan, expressed as a unitless score. For broader context on what these metrics mean for technical SEO performance, these three together define page-experience quality in Google Search.
How CrUX Field Data Powers the Report
The Core Web Vitals report uses CrUX (Chrome User Experience Report) field data — not Lighthouse lab scores. CrUX collects real performance measurements from Chrome users who have not opted out of usage reporting, anonymized and aggregated across a 28-day rolling window that updates daily. This is the same dataset Google Search uses as a ranking signal — not the Lighthouse Performance Score in PageSpeed Insights.
The classification rule is the 75th percentile (p75): a URL group is classified as "Good" for a metric only if at least 75% of real Chrome page views fall within the Good threshold for that metric. A URL group where 74% of LCP readings are under 2.5 s is classified as "Needs Improvement" — not Good — because the p75 just crosses the threshold. This is a deliberately conservative measurement: it ensures classification reflects the experience of the slower quartile of real users, not just the median. Google's Core Web Vitals report documentation confirms the 28-day window and p75 classification rule.
CrUX data requires sufficient traffic to be statistically valid. When a URL or URL group has too few Chrome page views to generate a reliable sample, the report shows "Not enough data." This is a data coverage gap, not a passing grade. Sites with limited traffic frequently see this across most or all URLs — the correct response is to use PageSpeed Insights lab diagnostics (Lighthouse) for those URLs, not to interpret the absence as good performance. See Index Coverage & Indexing for how GSC's other Experience-section report intersects with overall site health, and Enhancements & Rich Results for the remaining active reports in the Experience section.
Key Takeaways
- INP replaced FID on March 12, 2024. First Input Delay is deprecated and no longer appears in GSC. Any audit referencing FID as a Core Web Vital is outdated.
- "Not enough data" is not a passing grade. It means insufficient CrUX traffic for a statistically valid sample. Use PageSpeed Insights lab data as a fallback for these URLs.
- 48% of mobile origins pass all three CWV (2025 Web Almanac). LCP is the primary bottleneck at 62% pass rate — more than one in three mobile origins fails loading performance alone.
- GSC uses CrUX field data; Lighthouse uses lab data. A 90+ Lighthouse Performance Score does not guarantee Good status in the Core Web Vitals report. They measure different things.
- The Mobile Usability report was removed December 1, 2023. It no longer exists in GSC. Mobile-first indexing still applies; test mobile performance via PageSpeed Insights mobile mode.
- CWV is a tiebreaker ranking signal, not a dominant factor. Strong content with poor CWV outranks weak content with perfect CWV. CWV matters most when competing pages are near-equivalent in relevance.
- Fix CWV at the template level. Most issues — lazy-loaded LCP images, missing image dimensions, heavy third-party scripts — are caused by theme or template choices that affect hundreds of pages simultaneously.
48%
of mobile origins pass all three Core Web Vitals — the majority of the mobile web fails at least one CWV signal
2025 Web Almanac, Performance chapter (HTTP Archive + CrUX, July 2025)
62%
of mobile origins pass LCP — the lowest per-metric pass rate, making Largest Contentful Paint the primary CWV bottleneck
2025 Web Almanac, Performance chapter (HTTP Archive + CrUX, July 2025)
Mar 12, 2024
INP officially replaced FID as the Core Web Vitals responsiveness metric — a materially different measurement, not a renamed version
web.dev/blog/inp-cwv-march-12; web.dev/blog/inp-cwv-launch
Field Data vs. Lab Data: Why Your Lighthouse Score Is Not Your GSC Status
The most persistent misconception in Core Web Vitals work: a Lighthouse Performance Score of 90+ means your CWV are Good in Google Search. It does not. Lighthouse is a lab tool — it simulates a page load on a controlled device with fixed network throttling, producing a snapshot at that moment. The Core Web Vitals report in GSC uses CrUX field data — real Chrome user measurements across varied devices, connection speeds, and interaction patterns, collected over 28 days. The two frequently diverge. Google's own documentation on lab and field data differences confirms that the LCP element Lighthouse identifies in the lab can differ from the element real users see in their specific viewport and device context.
The practical split is this: CrUX field data is what Google Search uses for ranking. Lighthouse lab data is what you use to find and fix the root causes of bad CrUX data. Use PageSpeed Insights' "Discover what your real users are experiencing" section (field data) to confirm your ranking-signal status. Use PageSpeed Insights' "Diagnose performance issues" section (lab data) to identify which resources, scripts, or layout patterns are causing the problem. The Google Analytics 4 equivalent of this split: GA4 measures what users do after the page loads; CrUX measures what happens during the load.
MB Adv Agency has found that clients who report "our Lighthouse scores are great" frequently have "Needs Improvement" or "Poor" URLs in GSC — particularly on mobile, where the lab simulation uses a mid-range device profile that still underestimates the performance gap for users on budget Android handsets in congested network environments. The field data is the authoritative signal; the lab score is the diagnostic tool.
| Tool | Data type | Used for ranking | Diagnostic depth | Available for low-traffic pages |
|---|---|---|---|---|
| GSC Core Web Vitals report | Field (CrUX, p75, 28-day) | Yes | Low — surfaces URL group status; no root-cause detail | No — shows "Not enough data" |
| PageSpeed Insights — Field section | Field (CrUX, p75, 28-day) | Yes | Medium — per-URL; no root-cause detail | No — shows "no field data" for low-traffic URLs |
| PageSpeed Insights — Lab section | Lab (Lighthouse) | No | High — opportunity items and diagnostic detail | Yes — runs on any URL |
| Chrome DevTools Lighthouse panel | Lab (Lighthouse) | No | High — full profiling environment | Yes |
| web-vitals.js INP attribution build | Field (real-user RUM) | N/A — not Google's CrUX data | High — identifies specific slow interaction handlers | Yes — requires JS instrumentation |
The correct workflow: use GSC and PageSpeed Insights field data to identify which URL groups have a CWV problem and how severe it is. Then use Lighthouse (Chrome DevTools or PSI lab section) to identify the specific resources, scripts, or markup patterns causing the issue. Fix at the template level, deploy, and wait the 28-day CrUX rolling window for field data to reflect the change. See Performance Report & Search Analytics for how to combine CWV data with click and impression data to prioritize which URL groups to fix first by organic traffic impact.
Core Web Vitals Thresholds: The Complete Reference
Three metrics define Core Web Vitals as of March 12, 2024. Each has three status bands — Good, Needs Improvement, and Poor — and Google classifies a URL group based on its 75th-percentile (p75) reading across real Chrome user sessions in a 28-day rolling window. The thresholds below are stable and confirmed by web.dev's canonical Web Vitals reference and Google's threshold methodology documentation.
| Metric | Abbrev. | Good | Needs improvement | Poor | What it measures |
|---|---|---|---|---|---|
| Largest Contentful Paint | LCP | ≤ 2.5 s | 2.5 s – 4 s | > 4 s | Time from navigation start until the largest visible content element (image or text block) is rendered |
| Interaction to Next Paint | INP | ≤ 200 ms | 200 ms – 500 ms | > 500 ms | Near-worst-case latency of click, tap, and keyboard interactions throughout the full page visit |
| Cumulative Layout Shift | CLS | ≤ 0.1 | 0.1 – 0.25 | > 0.25 | Unexpected visual shifts of page content during load and lifespan — unitless score, not milliseconds |
| Deprecated: First Input Delay (FID) — replaced by INP on March 12, 2024. FID no longer appears in the GSC Core Web Vitals report. Any benchmark or audit referencing FID as a Core Web Vital predates the current standard. | |||||
Largest Contentful Paint (LCP) fires when the browser renders the largest above-fold element — typically a hero image, product photo, or above-fold heading. The LCP element is determined dynamically per page view; it is not always the same element across devices. The most common LCP failures stem from: the LCP image having loading="lazy" applied (which delays browser discovery), render-blocking JavaScript or CSS in <head> delaying HTML parsing, server response time exceeding 600 ms, and the LCP element being a CSS background image (which the browser cannot discover until CSS is parsed). Source: web.dev's Optimize LCP guide.
Cumulative Layout Shift (CLS) is the only Core Web Vital that is not a time-based measurement. It is a unitless score derived from the product of impact fraction (how much of the viewport shifted) and distance fraction (how far content moved). CLS above 0.1 is typically caused by: images and iframes without explicit width and height attributes (the browser reserves no space, and content reflows when the resource loads), dynamic ad slots without reserved minimum dimensions, or late-injected content above the fold (cookie banners, chat widgets) pushing content down after initial render. Source: web.dev's Optimize CLS guide.
Interaction to Next Paint (INP) uses the near-worst-case percentile of all interactions during a page visit — specifically, the 98th percentile of all interaction latencies measured during the session, then aggregated at p75 across page views in the CrUX window. "Near-worst-case" is Google's language: it excludes the absolute worst outlier interactions to reduce noise from accidental inputs. The 81% and 77% mobile pass rates for CLS and INP respectively (2025 Web Almanac) mean neither metric is perfectly handled — there is meaningful improvement opportunity across the web even for these higher-passing metrics.
Interaction to Next Paint: What Changed on March 12, 2024
On March 12, 2024, Interaction to Next Paint (INP) officially replaced First Input Delay (FID) as the Core Web Vitals responsiveness metric. This is confirmed by web.dev's INP launch announcement and Google's pre-launch notification. FID is deprecated, no longer appears in the GSC Core Web Vitals report, and was removed from CrUX tools and PageSpeed Insights after a six-month deprecation period. If your audit report or monitoring plugin still shows FID as a Core Web Vital, the tooling is outdated.
INP is not a renamed or recalibrated FID. The two metrics measure fundamentally different phenomena. FID measured only the input delay of the first user interaction after page load — typically a tap or click that happened before JavaScript had fully initialized. It was a narrow measurement that the majority of sites passed easily, because most first interactions occurred after JS initialization. INP measures the full interaction latency (input delay + processing time + presentation delay) of every click, tap, and keyboard interaction throughout the entire page visit and reports the near-worst-case percentile. A page can have excellent FID and failing INP if a complex state update mid-session — triggered by a tab switch, filter click, or form interaction — blocks the main thread for 600 ms. The Google Search Central announcement of INP explains the rationale for the transition.
| Attribute | FID (deprecated, pre-March 2024) | INP (current, from March 12, 2024) |
|---|---|---|
| What it measured | Input delay on the first user interaction only | Full interaction latency (input delay + processing + presentation) of all interactions throughout the visit |
| Threshold: Good | ≤ 100 ms | ≤ 200 ms |
| Threshold: Poor | > 300 ms | > 500 ms |
| Interaction scope | Single — first input only | Near-worst-case percentile (p98) of all click, tap, and keyboard interactions during the visit |
| Typical pass rate | High — most sites passed FID easily | Lower — 77% of mobile origins pass (2025 Web Almanac); sites with heavy JS frameworks frequently fail |
| Primary debugging method | Reduce long tasks at page load; defer JS initialization | Chrome DevTools Performance panel (profile actual interactions); web-vitals.js INP attribution build; Long Animation Frame (LoAF) API |
| Status in GSC | Removed — no longer in report | Current metric |
The debugging workflow for INP differs substantially from LCP work. LCP issues typically manifest at page load — they are caused by render-blocking resources, slow servers, or improperly prioritized images. INP issues manifest during user interaction — a click on a filter, a keyboard entry in a search field, a tab toggle. To diagnose INP failures: (1) open Chrome DevTools, navigate to Performance, and record a trace while reproducing the slow interaction; (2) identify Long Tasks in the main thread that correspond to the interaction timing; (3) use the web-vitals.js library's INP attribution build in production to identify which specific event handlers are slow across real user sessions. The LoAF (Long Animation Frame) API, available in Chrome 123+, provides per-frame attribution data that identifies which scripts are blocking the rendering pipeline during interactions.
Sites that "passed" CWV before March 2024 and now see "Needs Improvement" on INP did not experience a ranking penalty — they simply transitioned from being measured on an easier metric to a stricter one. The technical fixes that improved FID (reducing main-thread work at page load, code splitting, deferred JS) are still valuable but insufficient for INP. Heavy React or Angular single-page applications, sites with complex client-side filtering, and pages with embedded chat widgets or ad networks are the most common INP failure patterns. For cross-referencing paid and organic performance data, Google Ads Metrics & KPIs covers Quality Score — which includes landing page experience and is separately influenced by page speed on paid traffic.
Monthly US Search Volume — CWV Keyword Cluster by Full-Name Terms (Ahrefs, June 2026)

Reading the GSC Core Web Vitals Report: Structure and Terminology
The Core Web Vitals report lives at Experience > Core Web Vitals in the GSC left sidebar. It displays two top-level tabs: Mobile and Desktop. Each tab shows URL groups with their status across LCP, INP, and CLS. The report groups similar URLs for statistical reliability — a site with 1,000 blog posts on the same template typically shows as one URL group, not 1,000 rows. The URL group status reflects the worst-performing metric for that group at the p75 threshold. Google's Core Web Vitals report help documentation covers the full report structure.
| Report element | What it means |
|---|---|
| URL group | A cluster of similar URLs (e.g., all blog posts using the same template) that the report groups for statistical reliability. The "Examples" tab within each URL group lists representative individual URLs for testing. |
| Status: Good | The p75 for this URL group falls within the Good threshold for all three metrics. At least 75% of real Chrome page views meet the Good standard. |
| Status: Needs Improvement | The p75 for at least one metric falls in the Needs Improvement band. More than 25% of real Chrome page views exceed the Good threshold for that metric. |
| Status: Poor | The p75 for at least one metric exceeds the Poor threshold. More than 25% of real Chrome page views are in the Poor range for that metric. |
| Not enough data | The URL or URL group has insufficient Chrome user traffic to generate a statistically valid CrUX sample. This is a data coverage gap — not a passing grade. Low-traffic sites frequently see this across all URLs. |
| Mobile / Desktop tabs | Each tab uses CrUX data from that device type. Mobile and desktop CWV status often differ — mobile is harder and lags by 7–9 percentage points across the web (2025 Web Almanac). |
| Validate fix | After deploying a fix, click Validate fix to start a 28-day monitoring window. GSC notifies you when the issue is resolved. Validate fix does NOT speed up recrawling or CrUX data collection — it is a reporting trigger only. |
The "Not enough data" case deserves specific handling. When a site or URL group lacks sufficient CrUX traffic, the correct tool is PageSpeed Insights — enter the specific URL directly, and PSI runs Lighthouse lab diagnostics even when no field data is available. The lab results (Opportunities and Diagnostics sections) identify the same root-cause patterns that would produce poor CrUX readings if the URL had enough traffic. Use those lab results as the diagnostic input for your fix planning.
After deploying a fix, expect four to six weeks before the GSC Core Web Vitals report fully reflects the improvement. The 28-day rolling window means field data from before the fix remains in the window for up to 28 days. For individual high-priority pages, use URL Inspection → Request indexing to signal Googlebot that the page has changed — but note this does not accelerate CrUX data collection, only Googlebot's crawl prioritization. For sitemaps updates after template-level fixes, see Sitemaps & URL Inspection for the resubmission workflow. The GSC Trends & Future resource covers where CWV reporting is heading.
Core Web Vitals Pass Rate by Metric — Mobile Origins (2025 Web Almanac / HTTP Archive, July 2025)

Diagnosing and Fixing Core Web Vitals Issues
The most common misuse of the Core Web Vitals report: treating each failing URL as an individual fix ticket. For sites built on a CMS — WordPress, Webflow, Shopify, or similar — nearly all CWV failures trace to template or theme decisions that affect hundreds or thousands of pages simultaneously. A lazy-loaded LCP image on the homepage is almost certainly the same misconfiguration on every service page using the same header template. A CLS issue from an ad slot without reserved dimensions affects every page carrying that ad placement. Fix the template; the individual URL fixes follow automatically.
MB Adv Agency has found that the most impactful starting point for CWV remediation is identifying the URL templates driving the most "poor" URLs in the GSC report — specifically, the template group with the highest combined count of poor URLs weighted by organic traffic value — and fixing that template first. A single template fix can resolve hundreds of failing URLs simultaneously and produces measurable field data improvement within the 28-day CrUX window. Individual-URL fixes are reserved for pages with unusual content structures or embedded third-party components that differ from the template baseline.
| Metric | Common issue | Root cause | Fix approach |
|---|---|---|---|
| LCP | LCP image is lazy-loaded | loading="lazy" applied to above-fold image; browser delays load until the attribute is parsed |
Remove loading="lazy" from the LCP image. Add fetchpriority="high" to signal the browser to prioritize the resource. |
| LCP | LCP image is a CSS background | Browser cannot discover the image until CSS is parsed; no preload hint in HTML source | Add <link rel="preload" as="image" href="..."> in <head>, or migrate the element to an <img> tag. |
| LCP | Render-blocking JS or CSS in <head> |
Synchronous scripts or non-deferred stylesheets block HTML parsing, delaying when the browser discovers the LCP element | Defer non-critical JS. Inline critical CSS; load non-critical CSS asynchronously with media="print" onload="this.media='all'". |
| LCP | Client-side rendering (SPA) | LCP element is not in HTML source; browser must execute JS before discovering and loading it | Prefer server-side rendering (SSR) or static generation for content pages. Add <link rel="preload"> for the LCP image in the document <head>. |
| INP | Slow event handlers | Click or tap triggers large JS execution blocking the main thread for >200 ms | Profile with Chrome DevTools Performance panel. Break long tasks with scheduler.yield() or setTimeout(0). Defer non-critical work post-interaction. |
| INP | Heavy third-party scripts | Ad tags, analytics, chat widgets executing synchronously on user interactions | Audit third-party JS with WebPageTest. Lazy-load or sandbox non-essential third parties. Use PerformanceObserver to identify slow interaction events. |
| CLS | Images without explicit dimensions | Browser reserves no space; page reflows when image or iframe loads, shifting content below | Set explicit width and height on all <img> and <iframe> elements. Use aspect-ratio CSS as an alternative. |
| CLS | Dynamic ad slots without reserved space | Ad container collapses to zero until the ad loads, then pushes content down | Reserve minimum height for ad containers in CSS using min-height matching the expected ad size. Avoid inserting ad content above existing content. |
| CLS | Web fonts causing layout shift (FOUT/FOIT) | Flash of unstyled or invisible text causes reflow when custom font loads, shifting surrounding content | Use font-display: optional or font-display: swap. Preload critical fonts with <link rel="preload" as="font"> in <head>. |
| CLS | Late-injected above-fold content | Cookie banners, chat buttons, or notification bars injected after initial render push content down | Server-render above-fold injections, or reserve space for them. Never insert content above existing content mid-load. |
The triage workflow after identifying failing URL groups: (1) Open the failing URL group, click "Examples," and copy one representative URL. (2) Run that URL in PageSpeed Insights. (3) Confirm the field data status for the failing metric. (4) Review the Lighthouse diagnostics for the specific metric. (5) Identify the root-cause pattern from the table above. (6) Fix in the theme, layout template, or plugin configuration — not in individual page content. (7) After deployment, click "Validate fix" in GSC and monitor PSI field data during the 28-day CrUX window. Source references for fix approaches: Optimize LCP (web.dev), Optimize INP (web.dev), Optimize CLS (web.dev).
CWV Overall Pass Rate: Mobile vs. Desktop (2025 Web Almanac + HTTP Archive CrUX 2026)

The Mobile Usability Report Has Been Removed from GSC
The Mobile Usability report in Google Search Console, the Mobile-Friendly Test tool, and the Mobile-Friendly Test API were retired on December 1, 2023. Google announced the removal on December 4, 2023. If you are following a guide that instructs you to open the Mobile Usability report in GSC, that guide is outdated — the report no longer exists. Search Engine Land confirmed the retirement date and Google's stated reason: in the nearly ten years since launch, more robust mobile testing tools have emerged, including Lighthouse from Chrome.
The retirement does not reduce the importance of mobile-friendliness. Google operates mobile-first indexing for all sites — the mobile version of your page is what Google crawls and evaluates for ranking. The removal of the dedicated report changes where you check, not whether mobile performance matters. Additionally, Core Web Vitals CrUX field data includes measurements from mobile Chrome sessions — meaning a slow or unstable mobile experience directly affects LCP, INP, and CLS readings in the Core Web Vitals report, even without a separate "Mobile Usability" label. Google Search Central community confirms mobile-first indexing remains active.
| Deprecated report | Retirement date | Google's stated reason | Current replacement |
|---|---|---|---|
| Mobile Usability report (GSC) | December 1, 2023 | More robust tools available; Lighthouse provides equivalent coverage | PageSpeed Insights (mobile mode); Chrome DevTools device emulation; real-device testing |
| Mobile-Friendly Test tool | December 1, 2023 | Same as above | PageSpeed Insights mobile mode; Chrome DevTools device emulation |
| Mobile-Friendly Test API | December 1, 2023 | Same as above | Lighthouse CLI for bulk mobile testing; Rich Results Test API (for structured data) |
| Page Experience report (GSC) | 2024 (late) | Was a summary page linking to CWV + HTTPS reports; removed to reduce clutter | Core Web Vitals report (Experience > Core Web Vitals); HTTPS report (Experience > HTTPS) |
The current workflow for identifying mobile performance issues: run PageSpeed Insights at pagespeed.web.dev — by default, it runs in mobile mode (simulated Moto G Power with 4G throttling). The Diagnostics section surfaces viewport configuration issues, tap target sizing, and font legibility problems — the same class of issues the old Mobile Usability report flagged. For interactive layout inspection, use Chrome DevTools Device Toolbar (toggle device emulation with Ctrl+Shift+M or Cmd+Shift+M) and select a mobile device from the dropdown. For production monitoring across real devices, the Google Analytics 4 device breakdown report shows bounce rates and engagement metrics split by device category — a behavioral proxy for mobile experience quality when CrUX data is unavailable.
How to Triage the Core Web Vitals Report
The Core Web Vitals report is a triage tool, not a scorecard. The correct starting point is identifying which URL groups have the most "poor" URLs, checking Mobile and Desktop separately (they often differ), and using the "Examples" tab to surface specific testable URLs. The report does not identify root causes — it identifies which URL templates need investigation. Root-cause analysis happens in PageSpeed Insights and Chrome DevTools.
| GSC report shows… | Likely meaning | What to do next |
|---|---|---|
| "Not enough data" for most URLs | Insufficient Chrome user traffic for valid CrUX samples | Use PageSpeed Insights lab diagnostics for individual URLs; Lighthouse findings are actionable regardless of CrUX coverage |
| Many URLs "poor" on LCP, same URL group | Template-level LCP issue — likely hero image, header component, or above-fold CSS | Test one representative URL in PSI; check for loading="lazy" on LCP image, render-blocking resources, slow TTFB |
| Many URLs "poor" on INP | Heavy JS execution on user interactions; often third-party scripts or complex client-side state | Profile representative URL with Chrome DevTools Performance panel while reproducing a slow interaction; audit third-party scripts |
| Many URLs "poor" on CLS | Missing image dimensions, dynamic ad slots, or late-injected content — template-level pattern | Inspect layout shifts in Chrome DevTools Performance > Layout Shifts; check all <img> for explicit width/height; check ad slot CSS |
| "Needs improvement" but no "poor" URLs | Marginal performance — improvement is valuable but not urgent for ranking | Prioritize the metric closest to the "poor" boundary; fix highest-traffic templates first by organic traffic value |
| Only a few isolated URLs "poor" | Page-specific issue — unusual template, embedded widget, or specific content type | Investigate those specific URLs individually; check for embedded third-party content or non-standard templates |
| Green across all metrics | Field data confirms Good CWV across URL groups | Monitor monthly; test new template releases before deploy; check Mobile tab separately — desktop Good does not mean mobile Good |
When the Mobile tab shows "poor" URLs but the Desktop tab shows "good," the underlying cause is nearly always a mobile-specific performance gap — slower device processing, throttled network, or a mobile layout that loads additional resources the desktop version does not. Check the Core Web Vitals report documentation for how the Mobile and Desktop tabs use separate CrUX device-type datasets. The 2025 Web Almanac confirms that mobile CWV pass rates lag desktop by 7–9 percentage points across the web — a gap that has been consistent across measurement periods.
Current Page Experience Signals in Google Search
After the retirement of the Mobile Usability report (December 2023) and the Page Experience standalone report (2024), the active page experience signals in Google Search are: Core Web Vitals (LCP, INP, CLS), HTTPS, mobile-friendliness as a general expectation (without a dedicated GSC report), and intrusive interstitials. The Page Experience report previously surfaced all signals in one view; those signals remain in Google's ranking system even without the consolidated report surface.
| Signal | Still active | GSC report | Notes |
|---|---|---|---|
| Core Web Vitals (LCP, INP, CLS) | Yes | Core Web Vitals report (Experience section) | INP replaced FID March 2024 |
| HTTPS | Yes | HTTPS report (Experience section, added Sep 2022) | Surfaces pages that cannot be served over HTTPS; remains after Page Experience report removal |
| Mobile-friendliness | Yes (as general expectation) | No dedicated report (Mobile Usability report retired Dec 2023) | Test via PageSpeed Insights mobile mode or Chrome DevTools. Mobile-first indexing still applies. |
| Intrusive interstitials | Yes | No dedicated GSC report | Evaluated algorithmically; avoid full-page pop-ups on page load for mobile users |
| Safe Browsing | Security signal (not ranking) | Security Issues report (separate from page experience) | Google clarified in 2023 Safe Browsing is not a ranking signal; it was previously shown in the Page Experience report widget |
| AMP requirement | Removed (2021) | AMP status report exists for AMP-enabled sites | AMP is no longer required for Top Stories eligibility or page experience consideration; declining in relevance |
The Google Search Central page experience documentation remains the authoritative reference for the current set of active signals. For the HTTPS report specifically, see the Enhancements & Rich Results section of this GSC pillar cluster, which covers the full Experience section of the GSC sidebar including structured data alongside HTTPS signals.
Core Web Vitals Thresholds: LCP and INP in Milliseconds (web.dev, current)

Core Web Vitals Report Showing Widespread Poor URLs?
Identifying which URL templates are driving the most poor CrUX readings — and building a prioritized fix roadmap across LCP, INP, and CLS — requires reading field data and lab diagnostics together. MB Adv Agency maps your GSC report to template-level root causes and delivers a sequenced remediation plan.
Get a CWV Fix Roadmap →Methodology
CWV threshold data from web.dev (web.dev/articles/vitals, web.dev/articles/defining-core-web-vitals-thresholds; confirmed stable as of June 2026). CWV pass-rate benchmarks from the 2025 Web Almanac, Performance chapter (HTTP Archive + CrUX, July 2025 data; almanac.httparchive.org/en/2025/performance) and HTTP Archive CrUX report 2026 trend data (httparchive.org/reports/chrome-ux-report). INP/FID transition date confirmed via web.dev/blog/inp-cwv-march-12 and Google Search Central blog. Mobile Usability retirement date confirmed via Search Engine Land (December 4, 2023 article). Page Experience report removal confirmed via Search Engine Land (2024). Keyword data from Ahrefs, June 2026, operator-supplied. GSC absorbed zombie URL impression figures not used as benchmarks (May 2025–April 2026 inflation bug). Reviewed by MB Adv Agency, June 2026.

As a Google Ads expert, I bring proven expertise in optimizing advertising campaigns to maximize ROI.
I specialize in sharing advanced strategies and targeted tips to refine Google Ads campaign management.
Committed to staying ahead of the latest trends and algorithms, I ensure that my clients receive cutting-edge solutions.
My passion for digital marketing and my ability to interpret data for strategic insights enable me to offer high-level consulting that aims to exceed expectations.
Google Partner Agency
We're a certified Google Partner Agency, which means we don’t guess — we optimize withGoogle’s full toolkit and insider support.
Your campaigns get pro-level execution, backed by real expertise (not theory).
4.9 out of 5 from 670+ reviews on Fiverr.
That’s not luck, that’s performance.
Highly recommend Matteo to set up your server side tracking. He has a deep understanding of e-commerce tracking and will go above and beyond to make sure everything is set up correctly and working 100%. If you are scaling your store this set up is non-negotiable in my opinion and there isn't many people who have this much knowledge or put the effort in to get it right. Thanks again!

avorodesign.com
I can only recommend Matteo! He was very patient, professional and very knowledgeable about GA4, Consent Mode v2, and GDPR compliance. Communication was clear, and the setup was done professionally and efficiently. Highly recommend him for anyone needing reliable tracking implementation.

www.natureiki.life
Matteo shines in the realm of online professionals. His work is not only deep in data but also complemented by his proactive communication and cooperation, setting a new standard for freelancers. If you want someone who truly exceeds expectations, look no further. Highly recommended!

www.omanbeverlysmyth.com
Exceptional Service Beyond Expectations - Outstanding Service Impeccable depth, flawless delivery, and exceptional language fluency—this service exceeded all expectations. Highly recommended. Matteo truly ROCKS!!!

ium-paris.com
Top-notch, always highly value working with Matteo. An absolute Google Ads Genius. This is approximately the 8th time I have hired him and he's helped us get 6-7 ROAS. We are excited in continuing to improve our lead flow. Hire this guy if you need Google Ads help. Thanks Matteo!

www.dleeventgroup.com
I finally found the guy who can setup server side tracking and all the ecosystem properly. I definitely recommend Matteo. He is very responsive, kind and wants to dig into things. He configured GA4, Meta, Google Ads, Outbrain and google consent v2 with Cookiebot. Thanks Matteo.

inomega.fr
MB Adv delivered exceptional work with outstanding professionalism and lots of patience, taking time to see effects of changes made and not just do the work and submit it. The proactive communication and video summaries of the work completed made working with Matteo a pleasure, as he consistently went above and beyond. Highly recommended for web analytics projects! We are already working on another project.

www.withnellsensors.co.uk
Working with Matteo on my Google Ads was a game-changer. He's not just a strategist, he's a true partner. He understood my goals and tailored a campaign that perfectly reached my target audience. I'm grateful for his expertise and dedication.

dccargo.com
Click-driven mind
with plastic-brick obsession.
We build Google Ads campaigns with the same mindset we use to build tiny brick worlds: strategy, patience, and zero tolerance for wasted pieces.
Data is our blueprint. Growth is the only acceptable outcome.