Google Ads Metrics & KPIs: 2026 Benchmark Guide
5×
The cost-per-lead gap between the lowest- and highest-CPL industries in Google Ads search campaigns. Arts & Entertainment averages $26.84; Attorneys & Legal Services averages $131.63. Benchmarks without industry context are not benchmarks — they are guesses.
Source: WordStream / LocaliQ Google Ads Benchmarks 2026 · 13,474 US search campaigns, April 2025–March 2026
Google Ads Metrics Defined
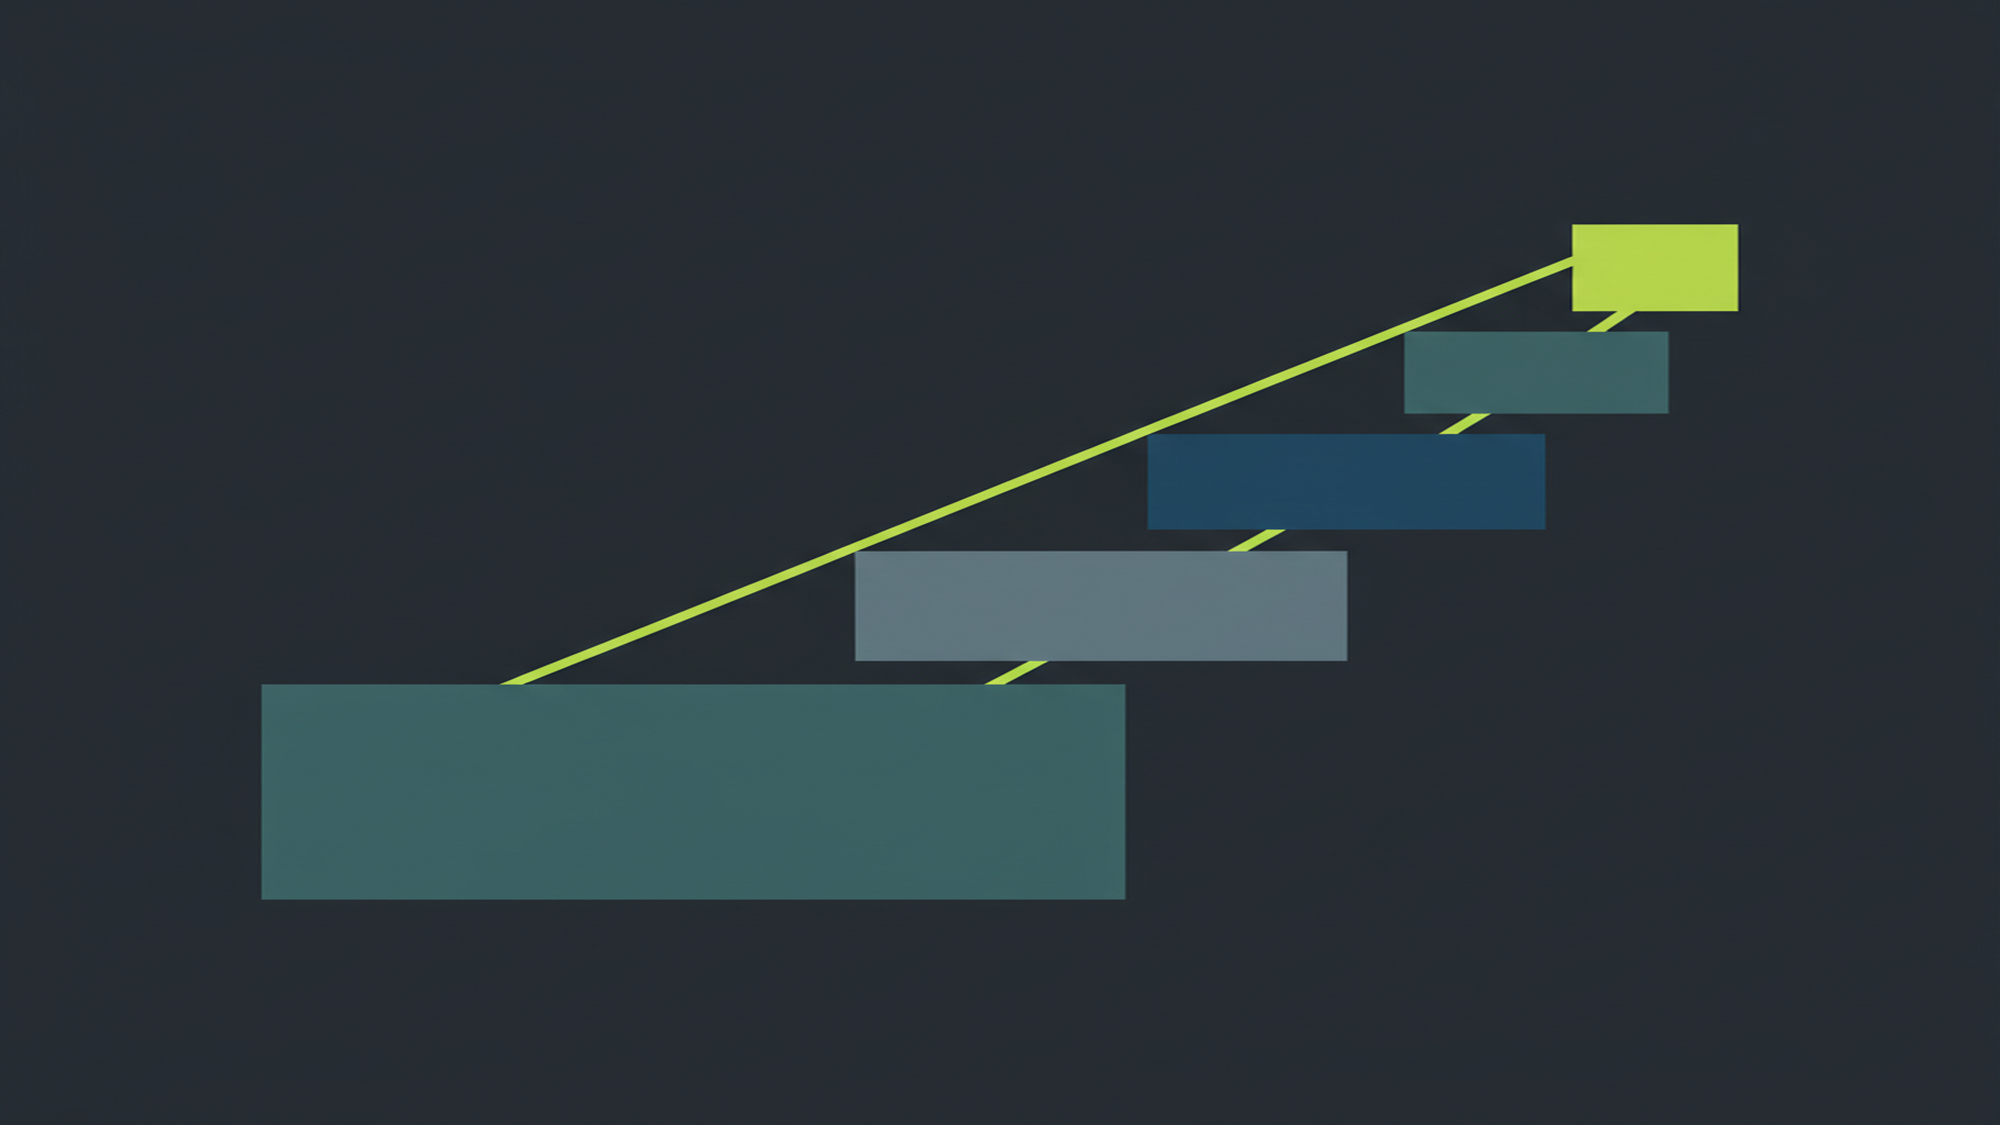
The six core Google Ads metrics — impressions, click-through rate (CTR), cost per click (CPC), conversion rate (CVR), cost per acquisition (CPA), and return on ad spend (ROAS) — form a causal chain. Each metric is the direct consequence of the one before it, not an independent number that can be judged in isolation.
Impressions are the starting point: the number of times an ad is shown in a Google search result. CTR is the ratio of clicks to impressions (Clicks ÷ Impressions × 100). Per the Google Ads Help — Clickthrough rate definition, CTR feeds the “expected CTR” component of Quality Score — it does not measure conversions or revenue. CPC is what the advertiser pays per click: Total Cost ÷ Clicks.
Clicks become conversions at the campaign’s conversion rate: CVR = Conversions ÷ Clicks × 100. CPA — cost per acquisition or cost per lead — is Total Cost ÷ Conversions, and it is the outcome metric for lead generation campaigns. ROAS — Revenue ÷ Ad Spend — replaces CPA as the primary outcome metric when conversion values are tracked, typically in e-commerce. The chain runs in one direction: better impressions and CTR do not automatically produce better CPA or ROAS unless conversion rate is also measured and optimised.
CTR measures ad relevance at the keyword-ad level — not business performance. A 2% CTR on a high-intent keyword that converts at 18% outperforms a 20% CTR on a broad-match query that converts at 0.3%.
Understanding the formula for each metric prevents the most common optimisation error: pulling the wrong lever. Improving CTR when the constraint is a low CVR wastes budget. Cutting CPC targets when IS Lost to Budget is above 30% limits reach on already-profitable traffic. The six metrics only become useful management tools when read as a chain, not as a scorecard of independent scores.
Click-Through Rate (CTR) in Google Ads
CTR = Clicks ÷ Impressions × 100. Per Google Ads Help — Clickthrough rate definition, CTR contributes to “expected CTR” — one of three Quality Score components — not to conversions or revenue. A campaign can hold a 15% CTR and a 0% ROAS simultaneously if the clicks never convert.
CTR gets misread as a success metric for a structural reason: it is the first signal that moves when an ad goes live, and it moves visibly. An account manager who has not configured conversion tracking defaults to CTR as the nearest available proxy for campaign health. That proxy is unreliable. A 10% CTR on a mismatched query string — broad-match “lawyer” serving to “watch Suits online” — is a targeting failure, not a win. The ad attracted curiosity clicks that will not convert, and the inflated CTR masks the problem.
CTR’s correct role is as a relevance signal at the keyword-to-ad level. A rising CTR on a tightly matched exact-match keyword group is useful evidence that ad copy improvements are working. A rising CTR across a campaign running modified broad match or Performance Max is meaningless without parallel conversion data. For a full account of how expected CTR interacts with Ad Rank in the auction, see Quality Score & Ad Rank in Google Ads.
The Metric Hierarchy: Outcomes vs. Diagnostics
ROAS and CPA are outcome metrics — they measure what the business gets back from ad spend. CTR, CPC, and Quality Score are diagnostic metrics — they explain why outcomes are what they are. Optimising a diagnostic metric without measuring its downstream outcome produces activity, not results.
The causal chain runs in one direction: Impressions → CTR → Clicks → CVR → Conversions → CPA / ROAS. Each arrow is a conversion event. A campaign with 100,000 impressions, a 6% CTR (6,000 clicks), a 5% CVR (300 conversions), and a $200 spend produces a $0.67 CPA — every number follows from the one before it. Changing any single variable changes every number downstream. That is why the hierarchy matters: the correct intervention is the one that addresses the weakest link in the chain, not the metric that looks most alarming in a dashboard.
Each diagnostic metric connects directly to the outcome above it. Quality Score — which Google explicitly labels a “diagnostic tool, not an auction input” — predicts expected CTR, ad relevance, and landing page experience. CPC is determined at auction by Ad Rank, which is itself a function of bid, Quality Score, and context signals. A higher Quality Score lowers CPC for the same Ad Rank position, compressing cost per click and therefore CPA without requiring a higher bid. The diagnostic chain explains cost; the outcome chain measures results. Both are required. See conversion tracking & attribution in Google Ads for the measurement layer that makes outcome metrics reliable.
Impression Share (IS) and its two sub-metrics — IS Lost to Budget and IS Lost to Rank — sit before cost metrics in the diagnostic hierarchy. They reveal whether a campaign is constrained by money or by relevance before CPA or ROAS data accumulates. IS Lost to Budget above 30% on a campaign with a profitable CPA means the campaign is winning its auctions but running out of budget before the day ends. IS Lost to Rank above 30% means the campaign is eligible for more auctions but losing them — the fix is Quality Score or bidding strategy, not budget. Source: Google Ads Help — Impression share.
Choosing the Right Primary KPI
E-commerce accounts with conversion value data optimise toward ROAS. Lead generation accounts without conversion values optimise toward CPA — cost per lead. Using the wrong primary KPI does not just produce an incomplete picture; it leaves the primary performance columns blank.
A lead generation advertiser who selects ROAS as the primary KPI will find the ROAS column reads zero or is unpopulated unless conversion values have been manually assigned to each lead action — which most lead gen advertisers do not do, because lead values vary by deal size, close rate, and sales cycle. Assigning arbitrary values (“every form fill = $100”) produces a ROAS number that is arithmetically correct and managerially meaningless. CPA — the raw cost to acquire one lead — is the standard outcome metric for lead generation because it requires no value assignment and maps directly to budget planning: if the target cost per qualified lead is $80 and the campaign CPA is $65, the campaign is profitable.
MB Adv Agency has found that the most common reporting error in inherited accounts is the wrong primary KPI — accounts optimized for impressions or CTR because conversion tracking was never configured, leaving ROAS and CPA columns blank. Correcting this starts with conversion tracking setup, followed by selecting the bidding strategy that matches the chosen KPI — Target CPA for lead gen, Target ROAS for e-commerce. See Google Ads bidding strategies for the full decision matrix. For industry-specific CPA benchmarks in high-CPL verticals, see Legal PPC services.
Key Takeaways
- ROAS and CPA are outcome metrics; CTR and Quality Score are diagnostics — optimizing the wrong tier produces misleading results.
- WordStream 2026 benchmarks show CPL ranging from $26.84 to $131.63 across 23 industries — industry context is required.
- Quality Score is a diagnostic tool, not an auction input — Google’s documentation states this explicitly.
- Impression Share (IS Lost to Budget vs IS Lost to Rank) reveals growth constraints before cost metrics show them.
- Post-2024 Google Ads counts all conversion actions per click — CVR data from pre-2024 reports uses different methodology.
- No single source publishes verified ROAS benchmarks across all 23 Google Ads industries — CPL is the standard outcome KPI for search.
6.64%
Avg CTR
$5.42
Avg CPC
8.18%
Avg Conv. Rate
$66.69
Avg CPL
WordStream / LocaliQ Google Ads Benchmarks 2026, 13,474 US search campaigns (April 2025–March 2026)
Search Impression Share: The Underused Diagnostic
Search Impression Share measures the fraction of available auctions a campaign actually enters — impressions received ÷ eligible impressions × 100. It diagnoses growth constraints before cost metrics reveal them, and it splits into two sub-metrics that identify different causes for the same problem.
IS Lost to Budget carries Google’s word-for-word definition: “The percentage of time that your ads weren’t shown on the Search Network due to insufficient budget.” When IS Lost to Budget exceeds 30% on a campaign already hitting a profitable CPA target, the budget ceiling is the growth constraint — not ad creative, not keyword selection, not landing page quality. The campaign is winning the auctions it enters; it simply runs out of daily budget before all available traffic is captured. The correct intervention is a budget increase, not a creative test.
IS Lost to Rank carries Google’s word-for-word definition: “The percentage of time that your ads weren’t shown on the Search Network due to poor Ad Rank in the auction.” When IS Lost to Rank exceeds 30%, the campaign is eligible for auctions it cannot win. Ad Rank is the compound of bid, Quality Score, and contextual signals — so the fix is Quality Score improvement (ad relevance, landing page, expected CTR) or a bid strategy adjustment, not a budget increase. A budget increase on a high IS-Lost-to-Rank campaign funds impressions in auctions the campaign would lose. See Quality Score & Ad Rank in Google Ads for the full Ad Rank formula and Quality Score improvement framework.
Neither IS column appears in the default Google Ads column set. Both require manual column customisation in the Campaigns view under the “Competitive metrics” section. Every reporting template — regardless of industry or campaign type — should include IS Lost to Budget and IS Lost to Rank alongside CTR and CPA. Without them, a campaign that appears healthy by CPA standards (cost is within target, conversions are positive) can silently be running at 40% of available capacity due to budget constraints. For local service businesses where budget discipline is especially consequential, see PPC management in Chicago and HVAC PPC.
MB Adv Agency has found that IS Lost to Budget above 30% on a profitable-CPA campaign is the single clearest signal to increase daily budget — not creative testing. The account is not underperforming; it is under-resourced. Adding budget to a campaign in this state produces linear growth in conversions at the same CPA — a direct, predictable return. Cites: Google Ads Help — Impression share and RebootIQ — Search Lost IS guide.
Google Ads Benchmarks by Industry (2026)
The WordStream 2026 benchmark dataset covers 13,474 US search campaigns across 23 industries. All figures are medians. Use these as a relative starting point — a “good” CPL in Legal Services ($131.63) represents a campaign failure in e-commerce.
| Industry | Avg CTR | Avg CPC | Avg CVR | Avg CPL |
|---|---|---|---|---|
| Animals & Pets | 7.49% | $4.06 | 16.22% | $31.50 |
| Apparel/Fashion & Jewelry | 6.64% | $4.44 | 4.50% | $97.51 |
| Arts & Entertainment | 12.75% | $1.63 | 5.91% | $26.84 |
| Attorneys & Legal Services | 5.87% | $9.87 | 5.55% | $131.63 |
| Automotive — For Sale | 8.28% | $2.27 | 6.01% | $44.26 |
| Automotive — Repair/Service | 5.56% | $4.35 | 15.51% | $29.96 |
| Beauty & Personal Care | 6.75% | $4.62 | 10.35% | $39.25 |
| Business Services | 6.10% | $5.87 | 4.85% | $93.69 |
| Career & Employment | 5.88% | $5.81 | 3.05% | $67.36 |
| Dentists & Dental Services | 5.66% | $8.00 | 10.67% | $72.97 |
| Education & Instruction | 7.56% | $4.81 | 13.14% | $77.48 |
| Finance & Insurance | 9.83% | $3.39 | 2.64% | $74.44 |
| Furniture | 6.57% | $3.97 | 2.99% | $106.70 |
| Health & Fitness | 5.81% | $6.17 | 6.94% | $67.36 |
| Home & Home Improvement | 6.47% | $8.33 | 8.05% | $90.92 |
| Industrial & Commercial | 6.57% | $5.87 | 8.20% | $75.19 |
| Personal Services | 7.16% | $7.17 | 12.34% | $54.60 |
| Physicians & Surgeons | 6.61% | $4.76 | 12.43% | $40.04 |
| Real Estate | 7.61% | $3.22 | 3.70% | $102.51 |
| Restaurants & Food | 6.83% | $2.05 | 8.05% | $30.57 |
| Shopping/Collectibles | 8.28% | $4.14 | 4.01% | $49.40 |
| Sports & Recreation | 8.75% | $2.77 | 7.69% | $44.26 |
| Travel | 9.32% | $2.14 | 5.83% | $44.70 |
| ALL-INDUSTRY AVERAGE | 6.64% | $5.42 | 8.18% | $66.69 |
Source: WordStream / LocaliQ Google Ads Benchmarks 2026 (13,474 US search campaigns, April 2025–March 2026, median figures)
Three verticals stand out as structural outliers: Dental PPC achieves a 10.67% CVR against an $8.00 CPC — a conversion-to-cost ratio that reflects high local intent and appointment-based query structures. Real Estate PPC posts the starkest efficiency gap: a 7.61% CTR paired with a 3.70% CVR and a $102.51 CPL, indicating that real estate clicks attract early-funnel researchers rather than transaction-ready buyers. Financial Services PPC delivers the lowest CVR in the dataset at 2.64% — compliance constraints on ad copy, restricted keyword lists, and a long consideration cycle all compress the conversion rate regardless of bid efficiency.
Google Ads Benchmark Trends: 2025 vs. 2026
CPL fell 4.88% year-over-year — from $70.11 in 2025 to $66.69 in 2026 — the first decline in five years. CVR improved 8.78% while CPC rose 3.04%, producing a more efficient cost structure overall.
| Metric | 2025 Avg | 2026 Avg | YoY Change |
|---|---|---|---|
| CTR | 6.66% | 6.64% | −0.30% (flat) |
| CPC | $5.26 | $5.42 | +3.04% |
| CVR | 7.52% | 8.18% | +8.78% |
| CPL | $70.11 | $66.69 | −4.88% |
Source: WordStream / LocaliQ Google Ads Benchmarks 2026 (13,474 US search campaigns, April 2025–March 2026, median figures) vs. WordStream Google Ads Benchmarks 2025
| Industry | CPC Change (YoY) | Direction |
|---|---|---|
| Real Estate | +27.27% | Increase |
| Personal Services | +23.41% | Increase |
| Health & Fitness | +23.41% | Increase |
| Education & Instruction | −22.79% | Decrease |
| Beauty & Personal Care | −18.95% | Decrease |
Source: WordStream / LocaliQ Google Ads Benchmarks 2026 vs. WordStream Google Ads Benchmarks 2025
The 4.88% CPL decline is the first downward move in the metric since WordStream began tracking it. Three forces explain the shift: Smart Bidding maturation — Target CPA and Target ROAS strategies now have more conversion history to train on, compressing cost per conversion across accounts; advertiser consolidation, with smaller accounts exiting the auction after multi-year CPC inflation, leaving larger advertisers with lower competition at equivalent quality thresholds; and the 8.78% CVR improvement itself, which mechanically reduces CPL when CPC holds near-flat. The CPC increase of 3.04% is the smallest year-over-year rise in three reporting cycles, consistent with a competitive equilibrium rather than an auction arms race. For the prior year’s comparison data, see WordStream Google Ads Benchmarks 2025.
Average CPC by Industry: Google Ads Search Campaigns (2026)

Google Ads Metric Formulas and Definitions
Nine core metrics — from impressions through ROAS — with their formulas, what they measure, and their primary diagnostic use case in campaign management.
| Metric | Formula | What It Measures | Primary KPI Use Case |
|---|---|---|---|
| Impressions | Count of ad appearances | Reach — how often the ad was shown in search results | Brand/top-funnel campaigns; baseline for IS calculation |
| CTR | Clicks ÷ Impressions × 100 | Ad relevance at the keyword-to-ad level | Diagnostic only — feeds expected CTR component of Quality Score |
| CPC | Total Cost ÷ Clicks | Auction-level bid efficiency; cost of one click | Cost diagnostic — CPC × (1 ÷ CVR) = CPA; reduce via Quality Score improvement |
| Conversion Rate (CVR) | Conversions ÷ Clicks × 100 | Landing page and offer quality; post-click funnel efficiency | Bridge metric — ties ad-level performance to conversion outcome |
| CPA | Total Cost ÷ Conversions | Cost to acquire one lead or customer action | Primary outcome KPI for lead generation; benchmark against WordStream vertical average |
| ROAS | Revenue ÷ Ad Spend | Return multiple on spend; requires conversion value data | Primary outcome KPI for e-commerce; use Target ROAS bidding strategy |
| Search Impression Share (IS) | Impressions Received ÷ Eligible Impressions × 100 | Share of available auctions the campaign actually entered | Growth capacity indicator — IS below 60% signals untapped reach |
| IS Lost to Budget | % of eligible auctions missed due to insufficient budget | Budget-constrained impression loss; campaign winning but running out of daily spend | Budget increase signal — above 30% on profitable-CPA campaign: increase budget, not creatives |
| IS Lost to Rank | % of eligible auctions missed due to poor Ad Rank | Auction competitiveness; campaign entering but losing to better-ranked ads | Quality/bid signal — above 30%: improve Quality Score or adjust bid strategy |
Formulas sourced from Google Ads Help — CTR definition, Google Ads Help — CPA definition, and Google Ads Help — Impression share data
IS Lost to Budget and IS Lost to Rank do not appear in the default Google Ads column set. Both require manual addition via the Columns customisation menu in the Campaigns view, under the “Competitive metrics” section. Every reporting template should include these two columns alongside CTR and CPA — without them, a campaign can run at 40% of available capacity with no dashboard signal visible. See Google Ads Help — Impression share data for the column setup walkthrough.
Average Conversion Rate by Industry: Google Ads Search Campaigns (2026)

Campaign Diagnostic Framework: Symptom → Lever
A structured diagnostic sequence — matching observable symptoms to root causes and the levers that resolve them. Work from the top of the funnel down: check volume before cost, cost before conversion, conversion before revenue.
| Symptom | Likely Cause | Metric to Check | Lever to Pull |
|---|---|---|---|
| Low impressions; CTR and CVR are strong | IS Lost to Budget | IS Lost to Budget column; daily budget pacing report | Increase daily budget — campaign is winning auctions it enters but exhausting spend before day ends |
| Low impressions; CTR and CVR are weak | IS Lost to Rank | IS Lost to Rank column; Quality Score by keyword | Improve Quality Score or raise bid — campaign enters auctions it cannot win |
| High impressions; low CTR | Ad copy–keyword mismatch; broad match serving irrelevant queries | Search terms report; Quality Score ad relevance component | Tighten match types; add negatives; rewrite ad headlines to mirror keyword intent. See keywords and match types |
| High CTR; low CVR | Landing page–ad mismatch; post-click experience fails to deliver on ad promise | Landing page Quality Score; bounce rate; form completion rate | Align landing page headline and CTA to ad message; remove friction from conversion path |
| Strong CVR; CPA above target | CPC too high relative to lead margin; bids not segmented by intent or LTV | CPC by keyword; bid modifier by device/location; search term value distribution | Reduce bid on low-LTV keywords; apply negative bid adjustments by device. See bidding strategies |
| Strong CPA; low ROAS | Low conversion value; budget concentrated on low-AOV products or services | ROAS by product/ad group; conversion value report; AOV by campaign | Segment by conversion value; shift budget to high-AOV products. See campaign types |
MB Adv Agency has found that in local services accounts, advertisers most often conflate CTR improvements with campaign health — a 3% CTR increase that produces zero additional conversions is noise, not progress. The diagnostic framework above starts with conversion volume, not engagement rate.
Average Click-Through Rate by Industry: Google Ads Search Campaigns (2026)

Google Ads ROAS Benchmarks
No single source publishes verified ROAS benchmarks across all 23 Google Ads industries. WordStream 2026 — the largest publicly available dataset at 13,474 campaigns — uses CPL as the outcome KPI for search. ROAS data is available for e-commerce, not for lead gen or local services.
WordStream 2026 does not publish ROAS by industry because ROAS requires conversion value data that most SMB advertisers do not configure. Without a revenue figure attached to each conversion action, the ROAS column reads zero or remains blank. The two best-available sources for ROAS benchmarking operate on different panels: Triple Whale aggregates DTC e-commerce brands where conversion value tracking is standard, while Optmyzr samples a broader cross-account mix including accounts with and without conversion value data, producing an average that over-represents better-instrumented accounts. Neither panel is a substitute for industry-specific CPL benchmarks in lead generation.
| Source | Panel | ROAS | Caveat |
|---|---|---|---|
| Triple Whale | Ecommerce panel (35,000+ brands) | Median 2.04× overall; Pets 2.84×, Travel 4.30×, Home/Garden 6.70× | E-commerce only; DTC brand skew; excludes services and local |
| Optmyzr | All-account panel (21,425 accounts) | Q1 2026 avg: 4.31×; Q1 2025–Q1 2026 range: 4.29×–4.64× | Includes non-ecommerce; averages over-represent accounts with conversion value tracking configured |
| WordStream 2026 | Search campaigns (13,474) | Not published — CPL is the primary outcome KPI | No ROAS data available; most SMB search advertisers do not configure conversion values |
Sources: Triple Whale — What is a Good ROAS; Optmyzr Google Ads Benchmark Report Q1 2026; WordStream Google Ads Benchmarks 2026
For e-commerce advertisers using Google Ads, a ROAS of 2.04× (Triple Whale median) is the floor for break-even on most DTC margin structures — not a performance target. Optmyzr’s 4.31× Q1 2026 average represents a cross-account mix where higher-performing e-commerce accounts pull the figure up. Lead generation and service-based advertisers have no valid ROAS benchmark from these panels — CPL from the WordStream 2026 dataset is the correct comparison point. For accounts without conversion tracking, all ROAS figures are inapplicable; see conversion tracking and attribution in Google Ads to establish the measurement baseline first.
Cost Per Lead by Industry: What the Range Means
CPL spans a 5× range across industries — from $26.84 in Arts & Entertainment to $131.63 in Attorneys & Legal Services. A high CPL is not a failing campaign; it reflects the lead value in that vertical.
The industries with the highest CPL share two structural characteristics: the transaction value per acquired customer is large (legal contingency fees, real estate commissions, furniture ticket sizes), and the buyer decision cycle is long, requiring multiple touchpoints before a form fill or call occurs. Industries with low CPL share the opposite profile: high-frequency local intent (auto repair, restaurants, personal care), low decision friction, and a buyer who is ready to act at the moment of search. Treating a $131.63 Legal CPL as high — or a $26.84 Arts & Entertainment CPL as impressive — without this context produces wrong budget decisions.
| Industry | Avg CPL | Why CPL Is This Level | Service Page |
|---|---|---|---|
| HIGH-CPL VERTICALS | |||
| Attorneys & Legal Services | $131.63 | Contingency fee values and retainer sizes justify high acquisition cost; high-competition auction keywords (“personal injury lawyer” at $20+ CPC) drive base cost up. | Legal PPC |
| Furniture | $106.70 | Long purchase cycle (weeks of comparison shopping) and low CVR of 2.99% combine to push acquisition cost high despite moderate $3.97 CPC. | Furniture PPC |
| Real Estate | $102.51 | Buyer and seller leads require months of nurturing before closing; 3.70% CVR reflects searchers in early research phase rather than transaction-ready intent. | Real Estate PPC |
| Apparel/Fashion & Jewelry | $97.51 | 4.50% CVR in a browse-heavy category drives CPL up; fashion search intent spans awareness through purchase, and most clicks do not convert in the same session. | Fashion PPC |
| Home & Home Improvement | $90.92 | $8.33 CPC — the highest in the dataset — reflects intense competition among local contractors and national home services aggregators bidding on the same intent keywords. | HVAC PPC |
| LOW-CPL VERTICALS | |||
| Arts & Entertainment | $26.84 | 12.75% CTR and $1.63 CPC reflect low-competition, high-engagement searches (event tickets, local shows); intent is immediate and conversion friction is low. | — |
| Automotive — Repair/Service | $29.96 | High-frequency local intent (“oil change near me”, “brake repair [city]”) and a 15.51% CVR produce cheap leads; the buyer has already decided to act before searching. | Plumbing PPC |
| Restaurants & Food | $30.57 | $2.05 CPC and immediate decision intent (hunger-driven, time-sensitive searches) keep CPL low; conversion actions are typically clicks-to-call or direction requests. | — |
| Animals & Pets | $31.50 | 16.22% CVR — the highest in the dataset — reflects strong purchase intent and a category where repeat buyers convert quickly on branded and product-specific queries. | Pet Supplies PPC |
| Beauty & Personal Care | $39.25 | 10.35% CVR and moderate $4.62 CPC produce efficient CPL; appointment-based services (salons, spas) capture high-intent local searches with low auction competition. | — |
Source: WordStream / LocaliQ Google Ads Benchmarks 2026 (13,474 US search campaigns, April 2025–March 2026, median figures)
Which KPI to Prioritize by Campaign Type
The right primary KPI depends on campaign objective and whether conversion values are tracked. Using the wrong one produces a campaign that appears healthy in the dashboard while underperforming on business outcomes.
The most common mismatch is a lead generation account running on impression or CTR targets because conversion tracking was never configured. The account shows green metrics across the board — high impressions, strong CTR, stable CPC — while the CPA and ROAS columns remain blank. The second most common mismatch is an e-commerce account benchmarking against CPL data from WordStream rather than ROAS data from Triple Whale or Optmyzr, producing a target that is both irrelevant and unmeasurable. The table below maps campaign type to primary KPI and the diagnostic backup metrics that explain variance in that KPI.
| Campaign Type | Primary KPI | Diagnostic Backup |
|---|---|---|
| E-commerce (conversion values tracked) | ROAS | If ROAS target not met, check CPC and CVR as diagnostics; IS Lost to Budget if ROAS is strong but volume is below goal |
| Lead gen — local services | CPA / CPL | Benchmark CPL against WordStream vertical average; check IS Lost to Budget if CPA is on-target but lead volume is insufficient |
| Lead gen — B2B | CPA / CPL | Apply industry CPL benchmark with caution — B2B lead values are not in WordStream’s panel; set internal target based on deal size and close rate |
| Brand / top-funnel | Impression Share | IS Lost to Budget and IS Lost to Rank as sub-metrics; CTR as engagement signal; not a conversion-based KPI |
| No conversion tracking configured | Impressions / Clicks (fallback only) | Set up conversion tracking immediately — all other KPIs are meaningless without it. Impressions and Clicks are not business metrics; they are activity metrics. |
MB Adv Agency has found that the most common reporting error in inherited accounts is the wrong primary KPI — accounts optimized for impressions or CTR because conversion tracking was never configured, leaving ROAS and CPA columns blank. The KPI framework above is the first audit step in any account takeover.
KPI selection determines which bidding strategy is available. Target ROAS requires conversion value history; Target CPA requires conversion volume (Google recommends 30+ conversions in 30 days). Brand and top-funnel campaigns run on Target Impression Share — a separate bidding strategy with no conversion dependency. See Google Ads bidding strategies for the complete decision matrix, and conversion tracking and attribution for the measurement foundation that makes any KPI meaningful.
Average Cost Per Lead by Industry: Google Ads Search Campaigns (2026)

Benchmarks Tell You the Average. We Build You the Exception.
MB Adv Agency manages Google Ads campaigns for legal, financial, and home services clients who need CPL below the industry median — not at it.
See Legal PPC services →Working in home services or HVAC? See Flagstaff HVAC PPC benchmarks or Missoula plumbing PPC.
Google Ads Performance Trends: What 2026 Data Shows
The 2026 WordStream benchmark — covering 13,474 US search campaigns from April 2025 through March 2026 — delivers one headline finding: average CPL fell 4.88% YoY, from $70.11 to $66.69. This is the first CPL decline in five years.
What drove the CPL decline: CVR improved 8.78% (from 7.52% to 8.18%) while CPC rose only 3.04% (from $5.26 to $5.42). More efficient conversion downstream offset rising click costs. The net result is a cheaper lead even as individual clicks cost more — a structural shift in campaign economics that benefits advertisers running conversion-optimized strategies.
CPC volatility varies sharply by vertical. Real Estate saw the biggest CPC spike (+27.27% YoY) driven by increased competition among agents and aggregators. Education dropped the sharpest (−22.79% YoY) as institutional advertisers pulled back spend. These vertical-level moves are not uniform — a benchmark figure from 2025 does not reflect 2026 reality for every industry, and cross-vertical averages obscure the direction of individual category auctions.
CVR rose faster than CPC fell — the net result was a cheaper CPL even as individual clicks cost more. Smart Bidding portfolio strategies contributed to this efficiency gain across the industry.
Optmyzr’s cross-account data (21,425 accounts) shows ROAS largely stable quarter-over-quarter: 4.29× in Q1 2025, peaking at 4.64× in Q4 2025, returning to 4.31× in Q1 2026. The absence of meaningful ROAS deterioration alongside CPL improvement signals that the efficiency gains are real, not artifacts of lower spend or reduced auction participation. Cite: Optmyzr Q1 2026 Google Ads Benchmark Report.
The 2024 Conversion Counting Change and Its Effect on CVR
Since 2024, Google Ads defaults to counting all conversion actions per click. One click that triggers both a form submission and a phone call produces two conversions in the “Conversions” column.
Pre-change, “Converted clicks” counted a maximum of one conversion per click regardless of how many actions that click produced. Post-change, “Conversions” counts all qualifying actions in the attribution window. Advertisers comparing current CVR figures to pre-2024 reports — or to agency performance summaries from before the change — are comparing different methodologies. The 8.78% YoY CVR improvement in the 2026 WordStream benchmark reflects both genuine efficiency gains and this counting change for accounts tracking multiple conversion types.
Practical implication: if CVR appears to have “improved” in accounts that track multiple conversion types (form fill, phone call, chat), verify whether the counting methodology changed during the comparison period. Google Ads Help explains the distinction in conversion counting options and understanding conversion tracking data.
Using Impression Share to Find Your Growth Ceiling
Before cutting bids or rewriting ad copy, check Impression Share. IS tells you whether the growth constraint is the budget or the auction — and the answer determines which lever to pull.
IS Lost to Budget above 30% on a campaign with a CPA at or below target means the account is profitable and constrained by daily budget, not efficiency. The campaign wins the auctions it enters but runs out of spend before the day ends. Adding budget to this campaign produces linear growth in conversions at the same CPA. Rewriting creatives or adjusting bids does not — the creative and bids are already working. See bidding strategies in Google Ads for how to align budget allocation with Smart Bidding targets.
IS Lost to Rank above 30% indicates the campaign cannot win its fair share of auctions because Ad Rank is insufficient. The levers are Quality Score improvement and bid strategy — improving ad relevance, landing page experience, and expected CTR lowers the effective CPC required to hold position. Budget increases on a high IS-Lost-to-Rank campaign fund impressions in auctions the campaign consistently loses. See Quality Score & Ad Rank in Google Ads for the full Ad Rank formula and how it interacts with Quality Score. For managed accounts where IS diagnostics are part of the monthly reporting layer, see PPC management in Austin.
Three Expensive Google Ads Misconceptions
High CTR Equals a Good Campaign
CTR measures the ratio of clicks to impressions for a specific keyword-ad combination. Per Google Ads Help, it feeds “expected CTR” — a Quality Score component — not revenue. Cite: Google Ads Help — CTR definition. CTR is a diagnostic signal, not a business outcome metric. An account can post a 20% CTR and a zero ROAS simultaneously.
A 20% CTR on a broad-match keyword cluster for a legal services advertiser producing zero qualified leads is a budget drain. A 2% CTR on an exact-match competitor keyword converting at 18% is excellent. The question is not “is CTR high?” but “is CTR high for the keywords that convert?” CTR without conversion rate alongside it is half a data point.
MB Adv Agency has found that in local services accounts, advertisers most often conflate CTR improvements with campaign health — a 3% CTR increase that produces zero additional conversions is noise, not progress. The correct diagnostic sequence starts with conversion volume, then CPA, then works backward to CTR as an explanatory variable — not the other way around. For high-intent local verticals where this error is most common, see Insurance PPC and Missoula legal PPC.
There Is One Good CPA Across All Industries
The WordStream 2026 benchmark shows CPL ranging from $26.84 (Arts & Entertainment) to $131.63 (Attorneys & Legal Services) — a 5× spread across the same platform in the same year. A $70 CPL is outstanding for a plumbing lead and a failure for a $15 e-commerce transaction. The platform is the same; the economics are entirely different.
CPA benchmarks are a relative reference by industry and margin structure. A target CPA quoted without referencing the industry vertical, average transaction value, and customer lifetime value is a guess dressed as a standard. The same $50 CPL represents a healthy return for a $600 HVAC service call and a break-even loss for a $49 subscription product. See Plumbing PPC services and Dallas auto repair PPC for vertical-specific CPA framing. Cite: WordStream Google Ads Benchmarks 2026.
More Impressions Indicate a Healthier Account
Impressions measure how many times an ad was served. They do not measure whether it was served to a relevant audience, in the right geography, at the right time of day, or on a query with any purchase intent. Raw impression volume is not an account health signal — it is a reach signal that requires conversion rate to interpret.
An account with 10× the impressions of a competitor is likely running on broad match without a negative keyword list, bleeding budget on irrelevant queries. The correct impression-level diagnostic is Search Impression Share, not raw impression count. IS reveals what fraction of relevant, eligible auctions the campaign is actually entering — a 60% IS on a well-structured campaign outperforms a 95% IS on a campaign serving irrelevant searches. Cite: Google Ads Help — Impression share data. For keyword structure that controls which impressions are served, see keywords and match types in Google Ads and Fashion PPC.
Google Ads Metrics: Frequently Asked Questions
What is a good CTR for Google Ads?
The all-industry average CTR for Google Ads search campaigns is 6.64%, based on WordStream / LocaliQ Benchmarks 2026 (13,474 US search campaigns). A good CTR depends on the industry vertical: Arts & Entertainment averages 12.75%, while Automotive Repair averages 5.56% and Attorneys & Legal Services averages 5.87%. A CTR above the industry benchmark for the specific vertical is a useful reference point, not a performance goal. CTR measures ad relevance at the keyword-to-ad level, not business results. A 15% CTR on a mismatched broad-match query that produces zero conversions wastes budget. A 3% CTR on a high-intent exact-match keyword converting at 12% is a strong result. The correct diagnostic question: is CTR at or above the industry benchmark for the keywords that are producing conversions? Per Google Ads Help — Clickthrough rate, CTR contributes to expected CTR within Quality Score — not to CPA or ROAS directly.
What is a good CPA for Google Ads?
There is no single good CPA for Google Ads. The WordStream / LocaliQ Benchmarks 2026 (13,474 campaigns) shows average CPL ranging from $26.84 for Arts & Entertainment to $131.63 for Attorneys & Legal Services — a 5× spread across the same platform and the same campaign type. A $70 CPA is outstanding for a plumbing lead worth $400 in service revenue; it is a failure for a $15 e-commerce product with a 30% gross margin. The correct benchmark is the CPL for the specific industry vertical, adjusted for average transaction value and customer lifetime value. For local service verticals, the industry CPL is a starting point — margins in HVAC, plumbing, and legal vary enough that even vertical-level benchmarks require calibration against actual revenue. For vertical-specific CPA context, see HVAC PPC services and Legal PPC services.
What is a good ROAS for Google Ads?
No single source publishes verified ROAS benchmarks across all 23 Google Ads industries. The WordStream 2026 dataset — 13,474 campaigns — uses CPL as the primary outcome KPI for search, because most SMB advertisers do not configure conversion values, making ROAS impossible to calculate. The best available ROAS data comes from two sources. Triple Whale’s ecommerce panel (35,000+ brands) shows a median Google Ads ROAS of 2.04× overall, ranging from 2.84× for Pets to 6.70× for Home & Garden. Optmyzr’s cross-account panel (21,425 accounts, all types) shows ROAS stable between 4.29× and 4.64× across five quarters from Q1 2025 through Q1 2026. Both figures over-represent accounts with conversion value tracking. For lead gen and local service accounts, ROAS is not the right primary KPI — CPA is the correct outcome metric when conversion values are absent.
What is the difference between CPA and ROAS in Google Ads?
CPA (cost per acquisition) and ROAS (return on ad spend) are both outcome metrics, but they measure different things and apply to different campaign types. CPA = total ad spend ÷ number of conversions. It measures the cost of acquiring one lead or customer, and requires no revenue value. ROAS = revenue ÷ ad spend. It measures the revenue returned per dollar spent, and requires conversion values to be tracked. CPA is the right primary KPI for lead generation campaigns where conversions are form submissions, phone calls, or appointment bookings without trackable transaction values. ROAS is the right primary KPI for e-commerce campaigns where every conversion carries a revenue value that Google can record. Using ROAS for a lead gen account without conversion values produces blank columns in the dashboard. Using CPA for an e-commerce account that tracks revenue misses the margin data needed to optimize toward profitability. The choice of primary KPI determines which bidding strategy is available — see Google Ads bidding strategies for the full decision matrix.
What is Search Impression Share in Google Ads?
Search Impression Share (IS) measures the percentage of eligible auctions in which a campaign’s ads actually appeared. The formula: impressions received ÷ eligible impressions × 100. Per Google Ads Help — Impression Share, eligible impressions are estimated based on targeting settings, approval statuses, and quality signals. IS breaks into two diagnostic sub-metrics. IS Lost to Budget is the share of eligible impressions lost because the daily budget ran out: “The percentage of time that your ads weren’t shown on the Search Network due to insufficient budget.” IS Lost to Rank is the share lost because Ad Rank fell below the auction threshold: “The percentage of time that your ads weren’t shown on the Search Network due to poor Ad Rank in the auction.” Neither sub-metric appears in the default Google Ads column set. Adding both to the reporting template — alongside CTR and CPA — is the fastest way to identify whether a campaign’s growth constraint is the budget ceiling or an auction quality problem. MB Adv Agency has found that IS Lost to Budget above 30% on a profitable-CPA campaign is the single clearest signal to increase daily budget — not creative testing.
How do I calculate conversion rate in Google Ads, and why does it change?
Conversion rate in Google Ads = Conversions ÷ Clicks × 100. For example: 50 conversions from 500 clicks = 10% CVR. Since 2024, Google Ads defaults to counting all conversion actions per click in the “Conversions” column, per Google Ads Help — About conversion counting. This means one click that triggers both a form submission and a phone call tracking event produces two conversions, which increases reported CVR compared to the previous “Converted clicks” methodology (which counted a maximum of one conversion per click). The practical impact: accounts tracking multiple conversion types show higher CVR in current reports than in pre-2024 data. When comparing current dashboard CVR to reports from before 2024, or to benchmark data that used the older methodology, verify which column and counting mode was used. The all-industry average CVR for Google Ads search is 8.18% (WordStream 2026, 13,474 campaigns) — up from 7.52% in 2025, partly reflecting this counting change.
Not Sure Which Metrics Matter for Your Account?
MB Adv Agency audits Google Ads accounts to surface the KPIs and benchmarks that match your industry and margin structure — not industry averages.
Contact MB Adv Agency →Methodology
Benchmark data sourced from WordStream / LocaliQ Google Ads Benchmarks 2026 (13,474 US search campaigns, April 1, 2025–March 31, 2026, median figures across 23 industries). Year-over-year comparison uses WordStream Google Ads Benchmarks 2025 (16,000+ campaigns, April 2024–March 2025). ROAS data from Triple Whale (35,000+ ecommerce brands) and Optmyzr (21,425 accounts, Q1 2025–Q1 2026). Metric definitions per Google Ads Help documentation. Impression Share definitions quoted word-for-word from Google Ads Help — Impression share. Last updated: June 2026. Reviewed by MB Adv Agency, June 2026.

As a Google Ads expert, I bring proven expertise in optimizing advertising campaigns to maximize ROI.
I specialize in sharing advanced strategies and targeted tips to refine Google Ads campaign management.
Committed to staying ahead of the latest trends and algorithms, I ensure that my clients receive cutting-edge solutions.
My passion for digital marketing and my ability to interpret data for strategic insights enable me to offer high-level consulting that aims to exceed expectations.
Google Partner Agency
We're a certified Google Partner Agency, which means we don’t guess — we optimize withGoogle’s full toolkit and insider support.
Your campaigns get pro-level execution, backed by real expertise (not theory).
4.9 out of 5 from 670+ reviews on Fiverr.
That’s not luck, that’s performance.
Highly recommend Matteo to set up your server side tracking. He has a deep understanding of e-commerce tracking and will go above and beyond to make sure everything is set up correctly and working 100%. If you are scaling your store this set up is non-negotiable in my opinion and there isn't many people who have this much knowledge or put the effort in to get it right. Thanks again!

avorodesign.com
I can only recommend Matteo! He was very patient, professional and very knowledgeable about GA4, Consent Mode v2, and GDPR compliance. Communication was clear, and the setup was done professionally and efficiently. Highly recommend him for anyone needing reliable tracking implementation.

www.natureiki.life
Matteo shines in the realm of online professionals. His work is not only deep in data but also complemented by his proactive communication and cooperation, setting a new standard for freelancers. If you want someone who truly exceeds expectations, look no further. Highly recommended!

www.omanbeverlysmyth.com
Exceptional Service Beyond Expectations - Outstanding Service Impeccable depth, flawless delivery, and exceptional language fluency—this service exceeded all expectations. Highly recommended. Matteo truly ROCKS!!!

ium-paris.com
Top-notch, always highly value working with Matteo. An absolute Google Ads Genius. This is approximately the 8th time I have hired him and he's helped us get 6-7 ROAS. We are excited in continuing to improve our lead flow. Hire this guy if you need Google Ads help. Thanks Matteo!

www.dleeventgroup.com
I finally found the guy who can setup server side tracking and all the ecosystem properly. I definitely recommend Matteo. He is very responsive, kind and wants to dig into things. He configured GA4, Meta, Google Ads, Outbrain and google consent v2 with Cookiebot. Thanks Matteo.

inomega.fr
MB Adv delivered exceptional work with outstanding professionalism and lots of patience, taking time to see effects of changes made and not just do the work and submit it. The proactive communication and video summaries of the work completed made working with Matteo a pleasure, as he consistently went above and beyond. Highly recommended for web analytics projects! We are already working on another project.

www.withnellsensors.co.uk
Working with Matteo on my Google Ads was a game-changer. He's not just a strategist, he's a true partner. He understood my goals and tailored a campaign that perfectly reached my target audience. I'm grateful for his expertise and dedication.

dccargo.com
Click-driven mind
with plastic-brick obsession.
We build Google Ads campaigns with the same mindset we use to build tiny brick worlds: strategy, patience, and zero tolerance for wasted pieces.
Data is our blueprint. Growth is the only acceptable outcome.