How Much Do YouTube Ads Cost? CPV, CPM & CPC 2026

YouTube Ads 2026 — Cost at a Glance (YouTube-Specific, Vendor-Attributed)
$0.01–$0.05
Average CPV — skippable in-stream (AdConversion, Store Growers)
CPM range
$5–$12
Per 1,000 impressions (CTV: ~$16)
Demand Gen CPC
$0.50–$3.50
YouTube placements (Store Growers)
No fixed minimum
Auction
The "$10/day floor" is vendor lore
Sources: AdConversion ($1.04M real YouTube spend, B2B SaaS, 2023–24); Store Growers (cites Strike Social); DigitalApplied Q1 2026 composite. Auction-priced inside Google Ads — no rate card. Not mbadv client data.
How Much Do YouTube Ads Cost? The 2026 Cost Answer
YouTube ads cost $0.01–$0.05 per view (skippable in-stream), $5–$12 per thousand impressions (CPM), and $0.50–$3.50 per click (Demand Gen) — but there is no rate card. Every figure is auctioned inside Google Ads; what you pay is set by your objective, format, bid strategy, surface, and competition. Source: AdConversion, Store Growers, DigitalApplied.
The table below is the load-bearing reference — every figure is a third-party, YouTube-specific vendor estimate, not an official Google rate and not mbadv client data. The one figure deliberately missing is a Search benchmark: WordStream/LocaliQ’s $5.26 CPC is generic Google Search with zero YouTube data, so this pillar uses AdConversion, Store Growers, Strike Social, and DigitalApplied.
| Metric (what you're billed on) | 2026 range (vendors disagree — estimates, not a rate card) | Source (YouTube-specific) |
|---|---|---|
| Pricing model | Auction-based (inside Google Ads); you pay per result — CPV, CPM, CPC, or CPA by objective — no subscription / platform fee | Google Ads Help |
| CPV — skippable in-stream | ~$0.01–$0.05 (AdConversion avg $0.05, range $0.01–$0.19; Store Growers ~$0.05; DigitalApplied composite avg $0.024) — billable view = 30s / full ad / interaction | AdConversion / Store Growers / DigitalApplied |
| CPV — YouTube Shorts | ~$0.10–$0.30 per view (higher CPV than in-stream; lower CPM — billable at ≥10s or CTA engagement) | Store Growers (cites Strike Social Q1 2025) |
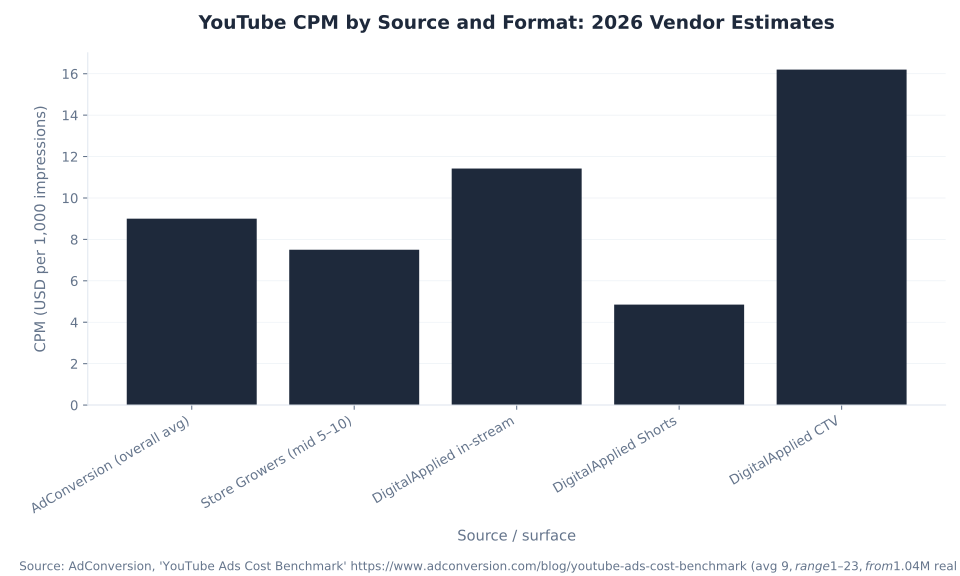
| CPM (per 1,000 impressions) | ~$5–$12 overall (AdConversion avg $9, $1–$23; Store Growers $5–$10; DigitalApplied in-stream $11.42 / Shorts $4.85) — CTV higher: ~$16.20 (see Table 2) | AdConversion / Store Growers / DigitalApplied |
| CPC (Demand Gen traffic) | ~$0.50–$3.50 (Store Growers Demand Gen $0.30–$1.50 overall; YouTube placements ~$0.50–$2+; AdConversion avg $3.56 — B2B-skewed high) | Store Growers / AdConversion |
| CPA / cost per conversion | No named-vendor YouTube-specific CPA table exists — soft band: general ~$20–$100, ecommerce ~$50–$150 (low-confidence, unattributed). Optimize via CPV/CPM to tCPA/tROAS targets instead | (qualitative band only — not mbadv data) |
Sources: AdConversion, "YouTube Ads Cost Benchmark" (CPV avg $0.05, range $0.01–$0.19; CPM avg $9, $1–$23; CPC avg $3.56, $0.05–$10.71 — from a real $1.04M YouTube spend dataset, B2B SaaS, 2023–24); Store Growers, "YouTube Ads Benchmarks" (in-stream CPV ~$0.05; Shorts CPV $0.10–$0.30; CPM $5–$10; Demand Gen CPC $0.30–$1.50, YouTube placements ~$0.50–$2+); DigitalApplied, "YouTube Ads Benchmarks," Q1 2026 composite (skippable CPV avg $0.024; CPM: in-stream $11.42 / Shorts $4.85 / CTV $16.20). NEVER cite WordStream/LocaliQ for YouTube — their $5.26 CPC is generic Search, not video.
Two details matter. First, the pricing model is set by the objective: Video views bills on CPV, reach on CPM, Demand Gen traffic on CPC. Second, AdConversion’s dataset is the strongest YouTube-specific primary — a real $1.04M YouTube spend (B2B SaaS, 2023–24), whose B2B-skewed averages pair with the broader Store Growers / Strike Social bands across verticals.
MB Adv Agency finds the most common cost mistake is applying a Search benchmark to a video buy — a $0.05 CPV and a $5.26 CPC measure different outcomes (a 30-second view versus a click). The useful question is not “what does a YouTube ad cost?” but “what outcome am I buying, and what does it cost on YouTube?” — the reframe that anchors every video budget we set for clients in legal, SaaS/software, and fashion and DTC.
The $0.05 AdConversion average CPV comes from a real $1.04M YouTube spend — the most credible YouTube-specific cost primary; Store Growers’ $5–$10 CPM (citing Strike Social) gives the broader cross-vertical band.
CPV vs CPM vs CPC on YouTube: What Each Billing Model Means
CPV (cost per view), CPM (cost per thousand impressions), and CPC (cost per click) are three billing models — and which one applies is set by the campaign objective, not a setting you pick. Calling a $0.05 CPV “cheaper” than a $1.50 CPC is a category error — they measure different outcomes.
CPV — cost per view is the metric for Video views campaigns (VVC). On skippable in-stream, the billable view is 30 seconds — or the full ad if shorter, or an interaction (CTA, card, or companion-banner click). In-feed and Shorts register a view at ≥10s of autoplay or a CTA engagement. That 10-second mark also underpins engaged-view conversions (EVC) — a viewer who watches ≥10s without clicking, then converts — so do not conflate it with the 30s in-stream billable view. Source: Google Ads Help, “About video views”.
CPM — cost per thousand impressions is the metric for reach campaigns (bumper, non-skippable in-stream, Efficient reach, Target frequency). Target CPM (tCPM) is automated — Google optimizes toward your average CPM; Viewable CPM (vCPM) is manual — you pay only for impressions viewable ≥2 continuous seconds. CPM also bills Masthead and YouTube Select reserved placements.
CPC — cost per click applies to Demand Gen campaigns on a traffic objective (Maximize clicks or Target CPC) — not pure Video reach or views. The $0.50–$3.50 range here is Demand Gen YouTube placements (Store Growers: $0.30–$1.50 overall, YouTube ~$0.50–$2+; AdConversion: avg $3.56, B2B-skewed). CPC on YouTube runs below Search CPC because the audience is browsing, not searching.
| Surface / format | Typical CPV | Typical CPM | Source |
|---|---|---|---|
| Skippable in-stream (mobile + desktop) | ~$0.01–$0.05 (mobile ~$0.022 / desktop ~$0.029; AdConversion avg $0.05) | ~$5–$12 (DigitalApplied ~$11.42; Store Growers $5–$10) | AdConversion / Store Growers / DigitalApplied |
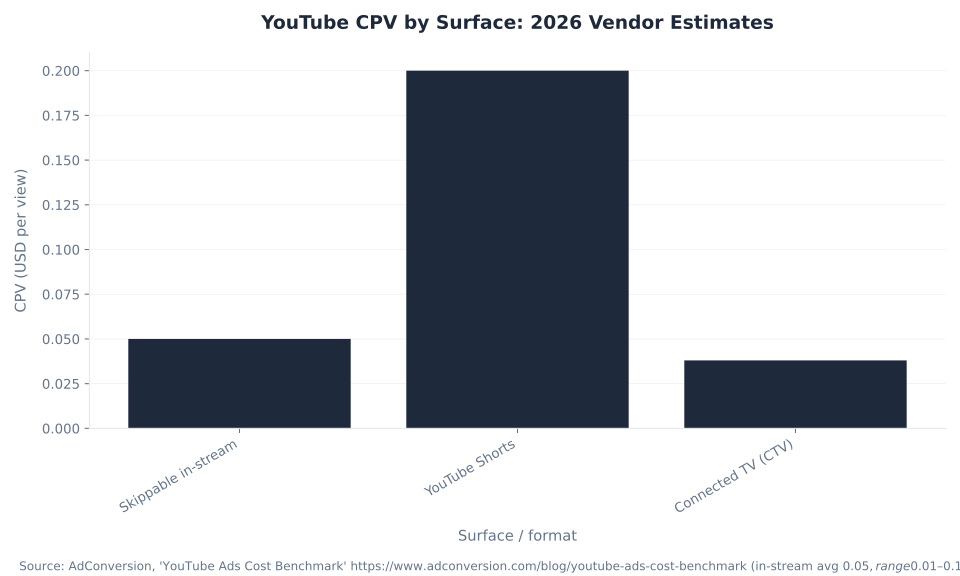
| YouTube Shorts (vertical 9:16) | ~$0.10–$0.30 per view (higher per-view; ≥10s or CTA) | ~$4.85 (lowest CPM of the three surfaces) | Store Growers (cites Strike Social) / DigitalApplied |
| Connected TV (CTV) — fastest-growing surface | ~$0.038 (CTV: non-skippable tendency; different billing event) | ~$16.20 (highest CPM surface) | DigitalApplied Q1 2026 composite |
| ★ The ordering | Shorts CPV > CTV CPV > in-stream CPV (Shorts CPV high despite lowest CPM) | CTV CPM > in-stream > Shorts. Surface is a cost lever — match to objective, not to the lowest unit price | DigitalApplied (composite) |
Sources: DigitalApplied, "YouTube Ads Benchmarks" Q1 2026 composite (skippable CPV avg $0.024; by device: mobile $0.022 / desktop $0.029 / CTV $0.038; CPM: in-stream $11.42 / Shorts $4.85 / CTV $16.20). Store Growers, "YouTube Ads Benchmarks" (in-stream CPV ~$0.05; Shorts CPV $0.10–$0.30, cites Strike Social; CPM $5–$10). AdConversion, "YouTube Ads Cost Benchmark" (CPV avg $0.05, CPM avg $9, from $1.04M real spend B2B SaaS 2023–24). CTV share: Nielsen "The Gauge," April 2026 (YouTube = 13.4% of total US TV viewing).
The surface pattern is counterintuitive: Shorts has the lowest CPM (~$4.85) but the highest CPV (~$0.10–$0.30) because a Shorts billable view needs ≥10s of watch, while CTV has the highest CPM (~$16.20) yet a CPV below Shorts (~$0.038) because CTV ads tend toward non-skippable formats billed on impressions. The POV: CTV CPM > in-stream > Shorts, but the cheapest surface is not always the most efficient buy. YouTube’s 13.4% of total US TV viewing (Nielsen “The Gauge,” April 2026) makes it the most-watched streaming platform on US TV screens, and CTV conversions grew 200%+ YoY Q1 2025→Q1 2026 (Google Brandcast 2026).
What Drives YouTube Ad Cost: The Six Levers
YouTube ad cost is not set by a rate card — six structural levers interact in the Google Ads auction. Understanding them separates a budget that delivers from one that burns spend on the wrong surface, audience, and season.
| Lever | How it moves cost | Practitioner note |
|---|---|---|
| 1. Objective + format | Decides the pricing model: CPV (views), CPM (impressions), CPC (clicks), or CPA (conversions). The single biggest structural cost lever | Comparing a CPV to a CPC and calling one cheaper is a category error. Pick the objective that matches the result you are paying for |
| 2. Bid strategy | Target CPV (tCPV) for views; tCPM / Target frequency for reach; Maximize conversions / Target CPA / Target ROAS for Demand Gen. Automated strategies let Google optimize to your average; manual strategies (vCPM) require you to set the exact rate | Start on the automated option (tCPV / tCPM / Maximize conversions) to find an efficient cost. Add a target (tCPA / tROAS) once you have conversion volume |
| 3. Surface / device | CTV CPM ~$16.20; in-stream CPM ~$5–$12; Shorts CPM ~$4.85. Within in-stream: mobile CPV ~$0.022 / desktop ~$0.029 / CTV ~$0.038 (DigitalApplied Q1 2026) | A premium CTV impression is not the same buy as a cheap Shorts view — match surface to the objective and audience, not to the lowest unit price |
| 4. Targeting breadth & competition | Broad interest targeting increases auction competition. Narrow custom-segment targeting reduces scale but can lower CPV. Vertical matters: DigitalApplied industry CPV range spans ~$0.018 (CPG) to ~$0.058 (Legal) | "Custom segments" (NOT separate custom affinity / custom intent — those were merged) built from keywords + URLs give intent-weighted targeting without the full cost of broad in-market |
| 5. Season (Q4 auction pressure) | Q4 holiday competition raises CPM across video inventory. Precise percentage shifts vary — web-verify a current Q4 premium at publish. January/February and summer off-peak periods typically carry lower CPM floors | Budget for Q4 CPM premium in annual media plans; shift brand-awareness buys to off-peak quarters if cost sensitivity is high |
| 6. Creative quality (ABCD) | Google's ABCD framework (Attention, Branding, Connection, Direction) guides creative that holds view rate. Higher view rate keeps CPV efficient — a high-performing creative lowers effective cost-per-result without changing the bid | Source: Google Ads Help, "ABCD creative framework" — built from 17,000+ campaigns with Ipsos/Nielsen/Kantar. Creative is free optimization |
Cost driver data: DigitalApplied, "YouTube Ads Benchmarks" Q1 2026 composite (industry CPV range $0.018–$0.058; device CPV mobile $0.022 / desktop $0.029 / CTV $0.038); AdConversion, "YouTube Ads Cost Benchmark" (B2B SaaS dataset — representative of high-competition vertical); Google Ads Help, "About bid strategies" (tCPV / tCPM / vCPM / Demand Gen strategies); Search Engine Land, "Google Ads Target CPV bidding" (tCPV replaced Maximum CPV, Apr 2025).
Of the six, objective + format is the most deterministic — it locks the pricing model before anything else. A Video views campaign (CPV) run when you need conversions pays for views from people who will never buy; a Demand Gen conversion campaign (CPA) run before it has signal forces Smart Bidding to guess, driving CPA up. The YouTube campaign types and objectives pillar covers the full routing.
MB Adv Agency finds vertical is the cost driver advertisers most underestimate: DigitalApplied’s Q1 2026 composite spans ~$0.018 CPV for CPG (broad, low-intent) to ~$0.058 for Legal (narrow, high-intent, expensive). Legal PPC and SaaS/software PPC sit at the high end by default — priced correctly, not broken.
Creative quality is the only cost lever that needs no higher bid or narrower audience. A video that holds view rate through the ABCD framework earns the same reach for fewer dollars per result.
YouTube Ads Bidding Strategies by Objective (2026)
The bid strategy is not a free choice — it follows from the objective; picking the wrong one (e.g. Viewable CPM for a conversions goal) optimizes for the wrong outcome. The 2026 changes: Target CPV replaced Maximum CPV for new Video views campaigns (April 2025), and Demand Gen replaced Video Action Campaigns (auto-upgraded through April 2026). Any guide listing Maximum CPV or VAC as creatable is out of date.
| Objective / goal | You pay by | Bid strategy (2026 current names) |
|---|---|---|
| Awareness & reach (Video reach campaigns) | CPM (impressions) | Target CPM (tCPM), Target frequency, Viewable CPM (vCPM) (manual — pay only for viewable impr.; video ≥2s continuous), or fixed CPM (Masthead reservation) |
| Video views (Video views campaigns — VVC) | CPV (30s / full ad / interaction) | Target CPV (tCPV) — replaced "Maximum CPV" for new VVCs from April 2025 (Search Engine Land). Existing Max-CPV campaigns can continue; new ones use tCPV |
| Conversions / Sales / Leads (Demand Gen) | CPA / conversion value | Maximize conversions / Target CPA (tCPA); Maximize conversion value / Target ROAS (tROAS) (value-based, works with Merchant Center product feeds). June 2026 rename: "Maximize conversions w/ Target CPA" → Target CPA |
| Website traffic (Demand Gen) | CPC (clicks) | Maximize clicks or Target CPC. Manual CPC is not a video reach/views strategy — pure Video reach and Video views campaigns buy on CPV or CPM |
| ★ Decision rule | — | Match strategy to objective; start on the automated option (tCPM / tCPV / Maximize conversions) to find efficient cost; add a target (tCPA / tROAS) once conversion volume is sufficient to defend a margin. vCPM and Manual CPC are niche use cases |
Sources: Google Ads Help, "About bid strategies / Video bid strategies" (tCPM, Target frequency, vCPM; Target CPV replaced Maximum CPV Apr 2025); Google Ads Help, "About Demand Gen campaigns" (Maximize clicks / Target CPC; Maximize conversions / Target CPA; Maximize conversion value / Target ROAS; June 2026 renames; Aug 17 2026 budget-handling change for tCPA/tROAS); Search Engine Land, "Google Ads Target CPV bidding" (tCPV replaced Maximum CPV; new VVCs from Apr 2025).
Target CPV (tCPV) sets an average you will pay per view and lets the auction optimize around it — not a maximum. Unlike the old Maximum CPV ceiling, it gives Google room to compete for high-value placements within your average, producing better view quality and lower effective cost-per-result. Source: Search Engine Land.
For Demand Gen conversion campaigns, Smart Bidding (Target CPA / Target ROAS) needs conversion volume; under-funding a new campaign starves it of signal and drives CPA up. Standard guidance (Store Growers): start on Maximize conversions for 2–4 weeks, then add Target CPA or ROAS — the same ramp as Google Search. The YouTube ads optimization and AI pillar covers Smart Bidding ramp and optimized targeting in depth.
YouTube Ads Budgets: Daily vs Campaign-Total and How to Set One
YouTube ads have no fixed dollar minimum — the “~$10/day floor” is vendor lore, not a Google Ads Help rule. The real question is not “what is the minimum?” but “how do I fund the bid strategy enough to gather signal?” Budget mechanics follow the same rules as all Google Ads video and Demand Gen campaigns.
| Budget type / item | How it works | Source |
|---|---|---|
| Daily budget | Your average daily spend target. Google can flex up to 2× on a given day when opportunity is high, capped at 30.4× the daily budget monthly. Best for always-on delivery; editable any time without campaign reset | Google Ads Help, "About budgets" |
| Campaign-total ("lifetime") budget | Available for Video / Demand Gen / PMax / YouTube campaigns with a defined start + end date. Google paces spend across the flight. Demand Gen / YouTube: minimum 7-day flight recommended; maximum 1 year. Best for fixed-window pushes (product launches, seasonal campaigns) | Google Ads Help, "About campaign total budgets" |
| Minimum-spend reality | No fixed dollar minimum for YouTube video ads. The "~$10/day" floor is vendor lore — Google Ads Help does not publish a video minimum. The practical floor is "enough for the bid strategy to gather signal in a reasonable test window" | Google Ads Help (no minimum stated for video) |
| ★ Starting-budget guidance | Fund Smart Bidding (tCPA / tROAS) enough to gather conversion volume. A practical test uses a steady daily budget over 2–4 weeks before judging results. Under-funding starves optimization and raises cost-per-result; over-pivoting on week-1 CPV data produces premature conclusions | Store Growers, "YouTube Ads Benchmarks" / practitioner guidance |
| Aug 17 2026 budget-handling change | A Google budget-handling update for tCPA / tROAS campaigns active from Aug 17 2026 can cause temporary spend fluctuations — this is expected system behavior, not a campaign error. Monitor but do not override | Google Ads Help, "About Demand Gen campaigns" |
Sources: Google Ads Help, "About budgets" (daily flex 2×/day, capped 30.4× monthly; no fixed dollar minimum for video); Google Ads Help, "About campaign total budgets" (Demand Gen / YouTube: min 7-day recommended, max 1 year); Store Growers (fund Smart Bidding for 2–4 weeks before judging; under-funding raises cost-per-result).
The 2× daily flex is not a bug — it is Google’s pacing for hitting your monthly cap. A $20/day campaign can spend $40 on a high-inventory Tuesday and $10 on a quiet Saturday, as long as the monthly total stays at or under $608 (30.4 × $20). So the correct check is monthly total vs 30.4× the daily budget, not a single day’s spend.
Campaign-total budgets suit fixed-window flights — a launch with a hard end date, a seasonal promotion — where Google paces the total across the flight (you cannot top one up mid-flight as you can a daily budget). For fashion and seasonal DTC campaigns or food and beverage promotional flights, they trade pacing flexibility for predictable spend control.
MB Adv Agency finds the “fund it enough to learn” principle is the most violated budget rule on YouTube: minimal daily budgets generate too few views or conversions for Smart Bidding to optimize, producing artificially high CPV and CPA in the first 7–10 days. A structured test — steady budget, consistent creative, 2–4 week window — is the right evaluation framework. For a pre-launch review of account setup, our team offers a Google Ads PPC audit covering budget pacing, bid-strategy alignment, and objective-to-format matching.
YouTube Ad Cost by Industry: Why Vertical Moves Your CPV
Vertical is one of the most significant cost drivers on YouTube, yet benchmark tables rarely break it out. DigitalApplied’s Q1 2026 composite shows industry CPV from ~$0.018 for CPG (broad, mass-market) to ~$0.058 for Legal (narrow high-intent, expensive competition, high LTV) — a 3× spread within the same skippable in-stream format.
| Industry vertical | Typical CPV estimate | Why it sits here |
|---|---|---|
| CPG / Consumer Packaged Goods | ~$0.018 | Broad audience, mass-market reach, low intent signal — high volume at low per-view cost |
| Retail / ecommerce | ~$0.024–$0.030 | Mid-range — broad enough to reach scale, intent-qualified enough to see bidding pressure |
| Automotive | ~$0.030–$0.040 | High-research purchase cycle; Demand Gen and skippable in-stream serve well here, with real CPV pressure from OEM competition |
| Finance / Insurance | ~$0.040–$0.055 | High client LTV, strong competition, regulated verticals push CPV up |
| Legal | ~$0.058 | Highest CPV in DigitalApplied's industry composite — narrow audience, enormous LTV per client, fierce competition at the targeting level |
Source: DigitalApplied, "YouTube Ads Benchmarks" Q1 2026 composite — industry CPV range ~$0.018 (CPG) to ~$0.058 (Legal). DigitalApplied methodology (account mix, regional scope) is not fully disclosed — treat as directional ranges, not precise rate cards. AdConversion's $1.04M dataset (B2B SaaS, 2023–24) is the stronger primary for individual-account CPV; DigitalApplied provides the best available cross-industry surface. Not mbadv client data.
The implication: benchmarking a Legal campaign’s $0.05 CPV against a CPG-sourced “YouTube average” falsely suggests Legal is overpaying. It is not — it is priced correctly for a narrow, high-LTV, competitive vertical. The right comparison is within the same objective, format, and vertical. For legal PPC clients or SaaS/software advertisers, MB Adv Agency benchmarks CPV against the Legal and SaaS end of the range, not the $0.024 composite average.
YouTube CPM by Source and Format: 2026 Vendor Estimates
YouTube CPM vs Other Video Platforms: Where Does It Rank?
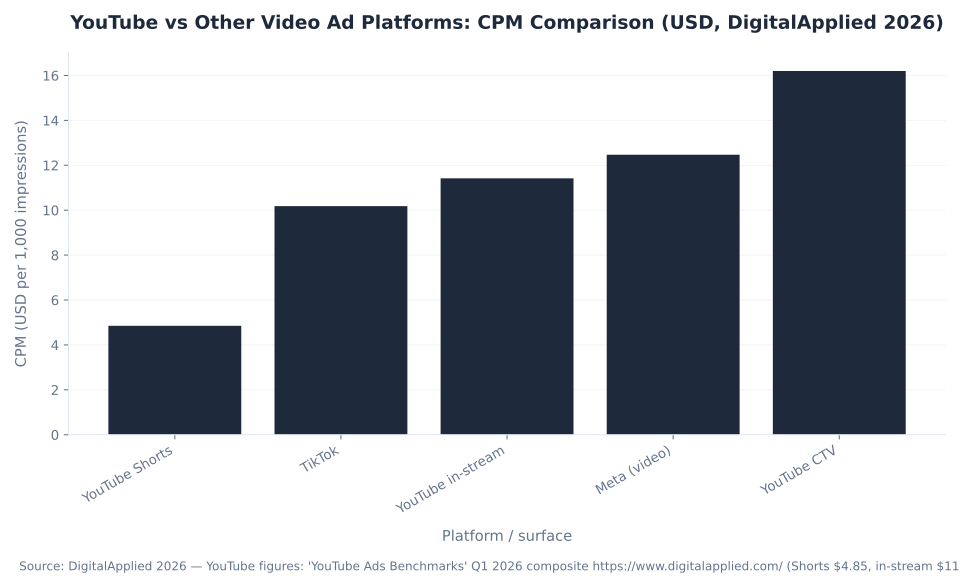
YouTube’s CPM range ($4.85–$16.20 by surface) sits across a wide band relative to other video platforms. DigitalApplied’s 2026 cross-platform data — the most methodologically consistent single-source comparison — puts YouTube in-stream at $11.42, between TikTok ($10.18) and Meta video ($12.47), with CTV highest at $16.20 and Shorts lowest at $4.85.
| Platform / surface | CPM (USD, DigitalApplied 2026) | Context |
|---|---|---|
| YouTube Shorts | $4.85 | Lowest-CPM YouTube surface; vertical 9:16 in Shorts feed; expanding on CTV as of 2025 |
| TikTok | $10.18 | Short-form video; younger skew; strong engagement benchmarks but different audience composition from YouTube |
| YouTube in-stream | $11.42 | The core YouTube CPM surface — pre/mid/post-roll on mobile, desktop, and TV; the most direct comparison to TikTok and Meta video |
| Meta (Facebook + Instagram video) | $12.47 | Includes Reels, in-feed video, and Stories across both platforms; strongest for DTC with established pixel history |
| YouTube CTV | $16.20 | Highest CPM surface — TV-screen placements reach YouTube's 150M+ US CTV monthly viewers; premium inventory commanding a premium rate |
Source: DigitalApplied, "YouTube Ads Benchmarks" Q1 2026 composite (YouTube CPM figures: https://www.digitalapplied.com/); TikTok and Meta CPM from DigitalApplied cross-platform CPM benchmarks 2026 — same vendor and methodology for cross-platform consistency. All figures are vendor estimates, not official rate cards. DigitalApplied methodology (account mix, regional scope, date range) not fully disclosed — treat as directional. For a deeper cross-platform cost-and-reach breakdown, see the youtube-ads-vs-other-video-advertising-platforms pillar.
The single-source approach (all five figures from DigitalApplied) is deliberate — mixing vendors introduces methodological inconsistency. Treat the absolute numbers as directional, but the relative ordering is robust: Shorts cheapest, CTV most expensive, in-stream the middle. The key insight: YouTube’s CPM range is wider than any single competitor’s, spanning Shorts ($4.85) to CTV ($16.20) — a 3.3× spread within one platform. So “YouTube CPM” is not a single number; it is a surface-selection decision that determines which part of that range you land in.
YouTube CPV by Surface: 2026 Vendor Estimates
Three YouTube Ad Cost Misconceptions (And Why They Matter)
YouTube ad cost is one of the most mis-cited topics in digital advertising. Three misconceptions appear consistently across blog posts, benchmark reports, and agency decks — each leading to structurally wrong budget decisions.
Misconception 1: "YouTube ads have a fixed price / there is a minimum bid."
YouTube ads are auction-priced inside Google Ads — no published rate card, no subscription fee, no fixed minimum bid for video. Every CPV, CPM, and CPC figure from vendors is a range from aggregated real-account data, not a Google rate. The price is set by the auction the moment your ad competes — by your bid, your Quality Score, your targeting, and competitors’ bids. Treating “$0.05/view” as fixed is wrong both ways: some placements cost $0.01, some $0.19. Source: Google Ads Help, “About budgets”.
Misconception 2: "The WordStream $5.26 CPC is the average YouTube ads cost."
WordStream/LocaliQ’s 2025 Google Ads Benchmarks report covers paid Search only and contains zero YouTube figures. The $5.26 headline is a generic Search CPC across 23 industries with no bearing on YouTube cost, which is priced on views and impressions. WordStream/LocaliQ is cited here only as the exclusion; the correct sources are AdConversion, Store Growers, Strike Social, and DigitalApplied. Applying a Search CPC to a video buy is a category error.
A YouTube skippable in-stream view (30 seconds of attention) and a Google Search click are priced on different scales. Never apply a Search CPC benchmark to a YouTube CPV or CPM decision.
Misconception 3: "The billable YouTube view is 10 seconds."
This drift confuses two 10-second thresholds. For skippable in-stream, the billable view is 30 seconds (or the full ad if shorter, or an interaction). Source: Google Ads Help, “About video views”. The 10-second mark appears in (1) in-feed and Shorts views, and (2) engaged-view conversions (EVC), where a viewer watches ≥10s without clicking, then converts. Conflating the 10s EVC threshold with the 30s billable view breaks CPV math — the real buy is 30 seconds at $0.01–$0.05. The metrics and measurement pillar covers EVC, VTC, and view-rate definitions.
YouTube vs Other Video Ad Platforms: CPM Comparison (USD, DigitalApplied 2026)
YouTube CTV Cost: Why the Premium CPM Earns Its Price
YouTube’s Connected TV (CTV) surface carries the highest CPM in its inventory — ~$16.20 (DigitalApplied Q1 2026) — and the highest CPV at ~$0.038 per view. Understanding why the premium exists, and when it is worth paying, is central to cost-efficient planning in 2026.
YouTube is the most-watched streaming platform on US TV screens — 13.4% of total US TV viewing, Nielsen “The Gauge,” April 2026; 150M+ Americans watch on a CTV device monthly (Google, 2025), and CTV conversions grew 200%+ YoY Q1 2025→Q1 2026 (Google Brandcast 2026). The premium reflects premium inventory: large-screen, lean-back viewing with high attention and increasingly shoppable formats.
For brand awareness or reach, the CTV premium buys YouTube’s largest-screen, highest-attention inventory. For Demand Gen conversions, CTV is upper-funnel — TV viewers click a direct-response CTA less than mobile or desktop users, so clicks and conversions come more from in-stream and Shorts. A Demand Gen campaign that ignores surface can let CTV consume budget at $16 CPM that would convert better at $11 on in-stream. The optimization and AI pillar covers placement exclusion.
YouTube CTV CPM (~$16.20) is 40% higher than in-stream (~$11.42) but reaches the highest-attention environment on the platform. A CTV impression is not the same buy as a mobile pre-roll — price them accordingly.
How to Set a Starting Budget for YouTube Ads
There is no universally correct YouTube starting budget. The right one funds the bid strategy long enough to gather the signal it needs — which varies by objective, vertical, and conversion volume. Here is the framework for setting one from what you can know before launch.
Step 1: Pick your objective first — it sets the pricing model and budget unit. A Video views campaign spends on CPV ($0.01–$0.05/view); a reach campaign on CPM ($5–$12/1,000 impressions); a Demand Gen conversion campaign on CPA (no reliable named-vendor table — optimize toward CPV/CPM, then transition to tCPA). Budget against the cost per outcome you are buying.
Step 2: Fund a 2–4 week test at a daily budget the algorithm can learn from. Smart Bidding needs conversion volume; a campaign generating five conversions a week has too little data to calibrate, so CPV and CPA stay erratic in the first 7–10 days. Cutting a test at week one on high early-stage CPV is the most common budget error MB Adv Agency encounters when auditing accounts via Google Ads PPC audit.
Step 3: Use the benchmarks to sanity-check, not to set. A $0.02 CPV (within AdConversion’s $0.01–$0.19 range) with a healthy view rate is likely normal; a $0.19 CPV with a below-norm view rate points to targeting or creative, not bid strategy. Use benchmarks to spot anomalies, not to set targets before you have your own account data.
Step 4: For Demand Gen, start on Maximize conversions, then layer in Target CPA. Running tCPA from day one without history forces Smart Bidding to guess; collect 30–50 conversions per month first. For SaaS and software lead-gen advertisers with lower volume, plan 6–8 weeks before tCPA stabilizes CPL. The MB Adv PPC services and PPC campaign management pages cover end-to-end strategy.
Are YouTube Ads Worth It? Cost Efficiency in Context
Whether YouTube ads are “worth it” depends on the right denominator. Cost per view ($0.01–$0.05), per thousand impressions ($5–$12), or per click ($0.50–$3.50) are not answers — they are the numerators. The denominator is the business outcome: a lead, a purchase, a brand query, a category-recall lift.
YouTube’s scale context matters: ~2.53 billion potential ad reach (DataReportal, Jan 2025 — a reach estimate, not a logged-in count) and 244M+ US adults 18+ (YouTube / Brandcast 2026); Shorts generates 200 billion daily views (Neal Mohan, Cannes Lions June 2025); and YouTube delivers 4.5× higher ROAS than other streaming TV (MMM data, Brandcast 2025). These are Google/YouTube attribution metrics — directional, not guarantees; compare them to your own model.
The practical assessment comes down to three questions. (1) Does your audience spend significant time on YouTube? If yes, the reach justifies testing. (2) Does your creative tell a complete story in 15–30 seconds? If no, low CPV with poor creative is not efficient. (3) Can you measure what happens after the view? Without conversion tracking (the Google tag + enhanced conversions + Consent Mode v2 for EU/EEA traffic), YouTube “cost per conversion” is unmeasurable. Across legal, SaaS, and fashion DTC advertisers, MB Adv Agency finds YouTube works most efficiently when measurement is solid — the metrics and measurement pillar and the Google Ads PPC audit are the right starting points.
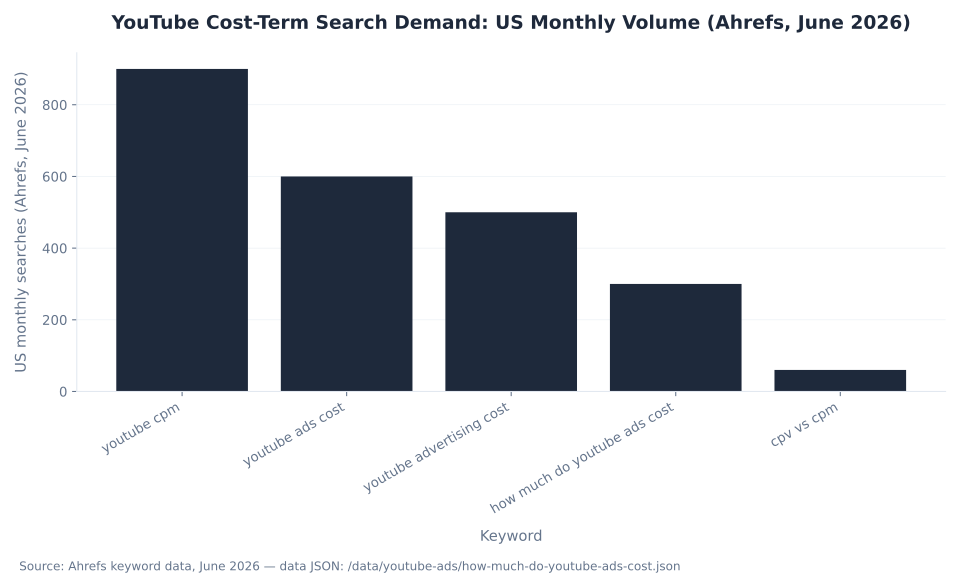
YouTube Cost-Term Search Demand: US Monthly Volume (Ahrefs, June 2026)
YouTube Ads Cost Audit
Is your YouTube CPV or CPA higher than these benchmarks?
A cost problem on YouTube is usually a structure problem — wrong objective, mismatched bid strategy, or a creative that cannot hold view rate. Our team identifies where the budget leaks and fixes the structural issues before scaling spend.
Request a Google Ads PPC Audit →YouTube Ad Cost: What Advertisers Are Actually Searching For
The keyword footprint reflects two reader intents: advertisers seeking a cost number before committing budget, and advertisers already spending who want to understand what they are billed for. The absorbed `understanding-cpm-cpv-and-cpc-in-youtube-ads` page ranked Ahrefs position 6 for “cpv vs cpm” — 60 US monthly searches, $3.50 CPC, 240 keywords in the GSC footprint — confirming the definitional intent carries real search value.
Across the seven tracked cost-intent terms (Ahrefs, June 2026), the cluster totals about 2,380 US monthly searches: “youtube cpm” leads (900/mo, KD 20); “youtube ads cost” (600/mo) and “youtube advertising cost” (500/mo) carry the highest commercial intent; “how much do youtube ads cost” (300/mo, KD 11, CPC $4.00) is the exact head term this pillar owns; and “cpv vs cpm” (60/mo) carries the definitional intent. The four charts below visualize the CPM range by vendor and surface (primary), CPV by surface (secondary), cross-platform CPM (context), and search-demand distribution (recommendations).
The head-term “youtube ads” separately tracks 19,000 US monthly searches (Ahrefs), confirming this cost pillar is the pricing entry-point for one of YouTube’s largest clusters. Advertisers who arrive via “how much do YouTube ads cost” convert best on the Google Ads PPC audit and PPC campaign management money pages; those asking “cpv vs cpm” convert better on the campaign types and objectives pillar and the optimization and AI pillar.
How to Control YouTube Ad Cost: Seven Steps
YouTube ad cost is a function of decisions you make before and during the campaign — not a fixed variable the platform sets. These seven steps are the structural levers in the right order.
Step 1: Pick the objective that matches your goal. Objective determines pricing model — a Video views campaign (CPV) does not generate conversions; a Demand Gen campaign (CPC/CPA) does not optimize for views. See YouTube campaign types and objectives.
Step 2: Choose the bid strategy that matches the objective. Target CPV for Video views; Target CPM or Target frequency for reach; Maximize conversions / Target CPA / Target ROAS for Demand Gen conversions; Maximize clicks / Target CPC for Demand Gen traffic. “Maximum CPV” is no longer creatable for new Video views campaigns (replaced by Target CPV, April 2025).
Step 3: Start on the automated bid option. tCPV, tCPM, and Maximize conversions optimize toward your average, not a ceiling. Manual strategies (vCPM, Manual CPC) require setting the rate correctly from the start and leave optimization upside on the table.
Step 4: Fund the campaign long enough to learn. 2–4 weeks at a consistent daily budget before judging. Smart Bidding needs conversion volume; under-funding the early phase raises long-run CPA.
Step 5: Consider surface and device. CTV CPM (~$16.20) suits brand awareness on the premium screen; Shorts CPM (~$4.85) suits reach at scale; in-stream ($5–$12) is the broad default. Check the placement report — CTV on a direct-response goal burns premium budget on an audience that does not click. See YouTube ad formats.
Step 6: Add a Target CPA or Target ROAS only after volume justifies it. Collect 30–50 conversions per month before layering in a tCPA. For SaaS advertisers with low monthly volume, this ramp extends to 6–8 weeks.
Step 7: Use creative quality as a free cost lever. Google’s ABCD framework — Attention, Branding, Connection, Direction (Google Ads Help) — is built from 17,000+ campaigns; a creative that holds view rate earns the same reach for fewer dollars per result. For a structural review of an account, see the Google Ads PPC audit and the contact page.
YouTube Ads Cost FAQ
Legal & SaaS YouTube Advertisers
High CPV doesn't always mean an inefficient campaign — but it does mean you need the right benchmark
Legal and SaaS advertisers sit at the top of the YouTube CPV range (~$0.058) by default — not because their campaigns are broken, but because high-LTV verticals attract high competition. Our team helps keep CPV and CPA in line with the economics of high-value leads.
Talk to MB Adv Agency →Methodology
This pillar consolidates two absorbed YouTube Ads glossary pages: how-much-do-youtube-ads-cost (0 GSC impressions — the natural head-term slug, upgraded in place) and understanding-cpm-cpv-and-cpc-in-youtube-ads (301’d in; Ahrefs pos 6 “cpv vs cpm,” 4,644 GSC impressions, 240 keywords). All CPV/CPM/CPC/CPA figures come from named YouTube-specific vendors: AdConversion (real $1.04M YouTube spend, B2B SaaS, 2023–24 — the CPV/CPM primary), Store Growers (cites Strike Social Q1 2025), and DigitalApplied (Q1 2026 composite — surface-level breakdown, weaker methodology). Bidding, budget, and format mechanics are verified against Google Ads Help, “About bid strategies”, “About Demand Gen”, and Search Engine Land. WordStream/LocaliQ is cited only as the exclusion. No mbadv client metrics are used; all agency POV is qualitative. Reviewed by MB Adv Agency, June 2026.
YouTube has emerged as one of the most powerful advertising platforms for businesses of all sizes, allowing for extensive reach and engagement. The platform provides various ad formats, targeting options, and, most importantly, flexible budgeting models. In this article, we will delve into the cost of YouTube ads, various factors influencing these costs, budgeting tips, and how YouTube advertising costs compare with other advertising platforms.
How Much Do YouTube Ads Cost?
The cost of YouTube ads can vary significantly based on various factors, including ad type, bidding strategy, target audience, and overall campaign goals. On average, businesses can expect to pay between $0.10 to $0.30 per view for TrueView ads, which means you pay only when viewers watch at least 30 seconds or to the end of your ad. For the cost per mille (CPM) model, businesses typically spend around $2 to $10 per 1,000 impressions. This variance allows advertisers to tailor their budgets according to their specific needs.
Additionally, YouTube ads can be categorized into different types, such as skippable in-stream ads, non-skippable in-stream ads, bumper ads, and overlay ads. Each of these formats has its pricing structure, which can affect the overall cost of your advertising campaign. For instance, non-skippable ads might come with a higher price due to their guaranteed viewer engagement, whereas skippable ads may provide more flexibility and a lower price point. Understanding these options is crucial for businesses looking to maximize their advertising effectiveness while managing costs.
Estimating Total Ad Spend
To effectively estimate your total ad spend on YouTube, you should consider several components. First, identify your audience size and how many impressions you aim to generate. If you are targeting a niche market, both the reach and rate could be higher, which might increase costs. Additionally, the geographic location of your target audience can also play a significant role; ads targeting viewers in high-demand markets may incur higher costs due to increased competition.
Furthermore, how long you run your campaign significantly influences total expenditure. A three-month campaign will generally be more expensive than a one-month campaign, assuming the same daily budget. Evaluating your specific marketing objectives can help determine the necessary budget. For example, if your goal is to launch a new product, you might consider a more aggressive spend to generate buzz quickly, while a brand awareness campaign could allow for a more gradual investment over time.
Average Spending by Businesses
Different businesses have varying budgets for YouTube ads. Small to medium-sized businesses generally spend anywhere from $300 to $3,000 per month, while large enterprises might allocate upwards of $10,000 monthly. However, spending should correlate with campaign goals; for example, if a company aims to achieve brand awareness, a higher investment could drive better results. Moreover, the industry in which a business operates can also influence ad spending; sectors like technology or fashion may require more substantial budgets to compete effectively.
It's also worth noting that the effectiveness of YouTube ads can be enhanced through strategic planning and creative execution. Businesses that invest in high-quality video content, for instance, often see better engagement rates, which can lead to improved return on investment (ROI). Additionally, leveraging YouTube's advanced targeting options, such as demographics, interests, and behaviors, can help ensure that ads reach the most relevant audiences, further optimizing ad spend and maximizing campaign impact.
Factors Affecting Ad Costs
Several factors can influence the overall costs of YouTube advertising. Understanding these can help you create a more effective strategy and allocate your budget wisely.

- Target Audience: The demographics and interests of your audience can significantly impact costs. Ads targeted towards a competitive audience may incur higher bids.
- Ad Format: As previously mentioned, various ad formats come with their specific costs. Non-skippable and bumper ads tend to be pricier due to guaranteed impressions.
- Competition: The level of competition in your industry affects what you will pay. If many brands are vying for the same audience, bids will increase accordingly.
- Geographic Targeting: Targeting more affluent or densely populated regions may lead to higher costs per impression compared to wider geographical targeting.
- Ad Quality: Higher quality and engaging ads are more likely to receive lower costs due to better viewer retention and engagement metrics.
Being aware of these factors allows you to refine your advertising strategy and, ultimately, improve your return on investment. Additionally, the timing of your ad campaigns can also play a crucial role in cost fluctuations. For instance, launching ads during peak seasons or major events can lead to increased competition and, consequently, higher costs. Conversely, running ads during off-peak times may yield lower costs and less competition, allowing for a more cost-effective approach.
Moreover, the relevance of your content to current trends can significantly influence your ad costs. Ads that resonate with trending topics or viral content can attract more viewers and engagement, potentially lowering your overall costs. Keeping an eye on social media trends and aligning your ad content accordingly can enhance your ad's performance and effectiveness.
Understanding Bidding Strategies
YouTube employs a bidding system where you can choose different strategies based on your goals. The two primary types of bidding are cost-per-view (CPV) and cost-per-thousand impressions (CPM). Choosing between these two can affect overall costs.
When using CPV bidding, you only pay when someone watches your ad. In contrast, CPM bidding means you pay for every 1,000 views, regardless of whether users engage further. Analyzing both strategies and optimizing them based on your campaign performance can lead to better-managed ad costs. Additionally, there are advanced bidding strategies such as target CPA (cost per acquisition) and maximize conversions, which can further tailor your approach to align with specific business objectives. These strategies allow advertisers to focus on achieving desired actions, such as website visits or product purchases, rather than merely increasing view counts.
Furthermore, understanding the nuances of your audience's viewing habits can also enhance your bidding strategy. For instance, analyzing peak viewing times and preferred content types can help you schedule your ads more effectively, ensuring they reach your audience when they are most engaged. This targeted approach not only maximizes your ad spend but also improves the overall effectiveness of your campaigns, leading to better performance metrics and a higher return on investment.
Tips for Budgeting Effectively
Crafting an effective budget for your YouTube ads is crucial to achieving your marketing objectives without overspending. Below are some tips to help you budget effectively.
- Set Clear Goals: Before initiating any campaign, define what success looks like for you. Whether it’s generating leads, increasing brand awareness, or driving sales, having clear goals allows you to allocate resources accordingly.
- Monitor Performance: Use YouTube's analytics tools to consistently track your ads' performance. Adjust budgets based on which ads yield the best returns to maximize efficiency.
- Experiment: Test different ad formats and targeting options systematically. Understanding which combinations work best will help narrow down your spending to the most effective strategies.
- Utilize A/B Testing: Run A/B tests for your ads to see which performs better. This approach can save money by investing only in ads that bring results.
By incorporating these strategies into your advertising approach, you will better manage your budgets and enhance overall expenditure efficiency.
Regularly Review Your Budget
Finally, it's essential to regularly review your spending. Changes in competition, market trends, and even viewer behavior can impact your ad performance. To remain agile and responsive in your budgeting strategy, regular assessments can illuminate areas where you may need to adjust your budget allocation for optimal effectiveness.
In addition to these reviews, consider setting up a schedule for your budget assessments. Monthly or quarterly reviews can help you stay on top of any shifts in performance and allow you to pivot quickly if necessary. Furthermore, don’t hesitate to involve your team in these discussions; diverse perspectives can lead to innovative ideas and strategies that you may not have considered. Collaboration can also foster a sense of accountability and shared responsibility for the campaign's success.
Another important aspect to consider is the seasonal fluctuations that may affect your advertising costs. Certain times of the year, such as holidays or major events, can lead to increased competition for ad space, driving up costs. By anticipating these trends and adjusting your budget in advance, you can ensure that your ads remain competitive and effective, even during peak times. This proactive approach can significantly enhance your overall advertising strategy and help you achieve your goals more efficiently.
Cost Comparison with Other Platforms
While YouTube ads have their unique pricing structure, comparing these costs to other advertising platforms can provide valuable perspective. For instance, Facebook and Instagram typically offer a cost per click (CPC) model in the range of $0.50 to $3.00, depending on the competition of the target audience.
Google Ads, on the other hand, can range widely from $1 to over $50 per click, again depending on the industry and competition. YouTube ads often have a lower barrier of entry in terms of CPM and CPV compared to these platforms, making them appealing for advertisers with limited budgets.
Advertising ROI
Ultimately, it’s not just about how much you spend but rather the return on investment (ROI) you achieve. Many marketers find that YouTube ads, while initially perceived as costly, can lead to highly engaging and effective results, particularly when it comes to brand awareness and customer retention.
By understanding the mechanisms, costs, and competing platforms, businesses can better harness the potential of YouTube advertising, ensuring that they navigate financial planning effectively.

As a Google Ads expert, I bring proven expertise in optimizing advertising campaigns to maximize ROI.
I specialize in sharing advanced strategies and targeted tips to refine Google Ads campaign management.
Committed to staying ahead of the latest trends and algorithms, I ensure that my clients receive cutting-edge solutions.
My passion for digital marketing and my ability to interpret data for strategic insights enable me to offer high-level consulting that aims to exceed expectations.
Google Partner Agency
We're a certified Google Partner Agency, which means we don’t guess — we optimize withGoogle’s full toolkit and insider support.
Your campaigns get pro-level execution, backed by real expertise (not theory).

4.9 out of 5 from 670+ reviews on Fiverr.
That’s not luck, that’s performance.
Highly recommend Matteo to set up your server side tracking. He has a deep understanding of e-commerce tracking and will go above and beyond to make sure everything is set up correctly and working 100%. If you are scaling your store this set up is non-negotiable in my opinion and there isn't many people who have this much knowledge or put the effort in to get it right. Thanks again!

avorodesign.com
I can only recommend Matteo! He was very patient, professional and very knowledgeable about GA4, Consent Mode v2, and GDPR compliance. Communication was clear, and the setup was done professionally and efficiently. Highly recommend him for anyone needing reliable tracking implementation.

www.natureiki.life
Matteo shines in the realm of online professionals. His work is not only deep in data but also complemented by his proactive communication and cooperation, setting a new standard for freelancers. If you want someone who truly exceeds expectations, look no further. Highly recommended!

www.omanbeverlysmyth.com
Exceptional Service Beyond Expectations - Outstanding Service Impeccable depth, flawless delivery, and exceptional language fluency—this service exceeded all expectations. Highly recommended. Matteo truly ROCKS!!!

ium-paris.com
Top-notch, always highly value working with Matteo. An absolute Google Ads Genius. This is approximately the 8th time I have hired him and he's helped us get 6-7 ROAS. We are excited in continuing to improve our lead flow. Hire this guy if you need Google Ads help. Thanks Matteo!

www.dleeventgroup.com
I finally found the guy who can setup server side tracking and all the ecosystem properly. I definitely recommend Matteo. He is very responsive, kind and wants to dig into things. He configured GA4, Meta, Google Ads, Outbrain and google consent v2 with Cookiebot. Thanks Matteo.

inomega.fr
MB Adv delivered exceptional work with outstanding professionalism and lots of patience, taking time to see effects of changes made and not just do the work and submit it. The proactive communication and video summaries of the work completed made working with Matteo a pleasure, as he consistently went above and beyond. Highly recommended for web analytics projects! We are already working on another project.

www.withnellsensors.co.uk
Working with Matteo on my Google Ads was a game-changer. He's not just a strategist, he's a true partner. He understood my goals and tailored a campaign that perfectly reached my target audience. I'm grateful for his expertise and dedication.

dccargo.com
Click-driven mind
with plastic-brick obsession.
We build Google Ads campaigns with the same mindset we use to build tiny brick worlds: strategy, patience, and zero tolerance for wasted pieces.
Data is our blueprint. Growth is the only acceptable outcome.