YouTube Ads vs Other Video Platforms 2026

YouTube Share of Total US TV Viewing — Nielsen The Gauge, April 2026
13.4%
#1 Streaming Platform on US TV Screens — Ahead of Netflix (~7.7%), Amazon (~3.4%), Hulu (~2.9%)
YouTube has held the #1 streaming position on US TV screens for about three years. 1 billion+ hours watched on TV screens every day. 150M+ Americans on YouTube CTV monthly. Source: Nielsen "The Gauge," April 2026; Neal Mohan YouTube CEO 2025 annual letter; Google/Brandcast 2026.
What Makes YouTube Different From Every Other Video Advertising Platform
The standard framing of "YouTube vs TikTok vs Meta vs CTV" misses the point. TikTok and Meta video/Reels are entertainment-interruption surfaces; pure CTV sells premium living-room reach. YouTube is different in kind: it is simultaneously the most-watched streaming platform on US TV screens, a search-and-intent engine inside Google's data graph, and a full-funnel machine spanning awareness through purchase on one Google Ads buy. No other platform here does all three.
The right frame is not "which video feed wins" but "what job does each do." YouTube's foundational role is the anchor — scale, living-room CTV, search-adjacent intent, and full-funnel performance on one buy. TikTok owns short-form virality and the youngest audience; Meta owns the social graph and retargeting; pure CTV owns premium content adjacency. YouTube does all of the above, plus what none of the others do: it catches buyers while they are actively searching and deciding, not just scrolling.
That difference has measurable consequences. When creators discuss products, viewers are 13× more likely to search the brand and 5× more likely to buy (Google internal, n=60, Feb 2026, Brandcast 2026) — a research-intent signal, not an entertainment feed. On the TV screen, YouTube reports 4.5× higher ROAS than other streaming TV (MMM, Brandcast 2025) at a CTV CPM of $14.20–$18.50 (DigitalApplied Q1 2026) — below pure-CTV's $25–$65. That combination of living-room screen, measured ROAS, and intent targeting on one buy exists only on YouTube.
This guide compares YouTube against TikTok, Meta video/Reels, and pure CTV across five dimensions — reach, cost, intent, formats, and measurement — then delivers a decision framework by goal, with vertical-specific emphasis for brands running DTC and fashion, SaaS lead generation, and legal services.
5 Key Takeaways: YouTube vs Other Video Advertising Platforms
Before the platform-by-platform data, five decisions every video advertiser faces — and where YouTube, TikTok, Meta, and pure CTV each stand.
- YouTube is the #1 CTV platform — not a mobile-first alternative. It commands 13.4% of total US TV viewing time (Nielsen "The Gauge," April 2026), #1 for ~3 years, with TV now the primary device by watch time. A plan that buys "CTV" as Roku and Hulu while excluding YouTube has left out the largest CTV platform. Source: Neal Mohan YouTube CEO 2025 annual letter.
- YouTube ad revenue was ~$40.37B in FY2025 — not $60B. The $60B figure includes ~$19–$20B in subscriptions; ad revenue alone was ~$40.37B (Tubefilter, Feb 5 2026). Citing $60B overstates the ad business by ~50% when sizing YouTube against TikTok and Meta.
- YouTube's conversion product is Demand Gen — Video Action Campaigns are retired. VAC cannot be created (retired ~April 2025; auto-upgraded through April 2026). Demand Gen is the full-funnel video product running across YouTube, Discover, Gmail, and Maps. See YouTube campaign types and objectives.
- YouTube CTV CPM ($14.20–$18.50) is far below pure-CTV CPMs ($25–$65). Roku mid ~$27.50, Amazon ~$42.50, Hulu ~$20 (Adsposure 2026). YouTube delivers the same screen at 40–60% lower CPM, with 4.5× higher ROAS than other streaming TV.
- "Run more than one" is the mature answer — YouTube is the anchor. TikTok creates virality, Meta scales social-graph retargeting, pure CTV buys premium sports adjacency; YouTube anchors because it delivers awareness, consideration, and conversion on one buy. The PPC services framework treats it as the foundation the others extend, not replace.
Video Advertising Platforms: The Numbers That Matter (2026)
Platform-scale, cost, and performance benchmarks — every figure attributed to a named source (YouTube from AdConversion/Store Growers/DigitalApplied; TikTok from Benly/WebFX; Meta from DigitalApplied; pure CTV from Adsposure/namediaexperts). WordStream/LocaliQ publish Google Search benchmarks only — their $5.26 CPC is generic Search, not a YouTube figure, and is excluded.
YouTube Ad Reach
~2.53B
DataReportal, Jan 2025 (ad/potential reach)
YouTube US Adults
244M+
Brandcast 2026 (~91% of US adults, Nov 2025)
YouTube In-Stream CPM
$11.42
DigitalApplied Q1 2026 (YouTube-specific)
Pure CTV CPM Range
$25–$65
Adsposure / namediaexperts 2026 (Roku/Hulu/Amazon)
YouTube ROAS vs Streaming TV
4.5×
MMM data, Google / Brandcast 2025
YouTube CTV Ad Conversion Growth
+200%+
YoY Q1 2025→Q1 2026, Brandcast 2026
YouTube Ads vs Other Video Advertising Platforms: At a Glance
YouTube, TikTok, Meta video/Reels, and pure CTV (Roku/Hulu/Amazon) play four structurally distinct roles in a video plan. The table below maps each across the dimensions that determine fit — how users arrive, what attention the ad buys, funnel position, and what it delivers on the living-room screen. The conclusion: YouTube does a different job from each, not the same job cheaper.
| Dimension | YouTube | TikTok | Meta (Facebook/Instagram Video & Reels) | Pure CTV (Roku/Hulu/Amazon) |
|---|---|---|---|---|
| Category | Search + social-scale video + #1 CTV screen (full-funnel) | Short-form entertainment feed | Social network — interruption feed + Reels | Premium streaming-TV inventory |
| How the user arrives | Searching / researching / watching (intent-rich) | Being entertained (short-form scroll) | Socializing / passive scrolling | Leaning back, watching long-form TV |
| Dominant ad model | Catch intent + buy attention (search-adjacent + reach) | Buy attention (entertain to convert) | Buy attention (interrupt the feed) | Buy premium reach (forced/limited-skip) |
| Funnel sweet spot | Full funnel — awareness → consideration → conversion | Top-funnel awareness / virality | Full funnel via social graph + retargeting | Upper-funnel premium awareness |
| Reach / scale (2026) | Ad reach ~2.53B (DataReportal); 244M US adults; #1 on US TV screens (Nielsen 13.4%) | ~1.5B+ global (vendor-cited); youngest active audience | FB ~3B+ / IG ~2B+ MAU (vendor-cited); broad demographics | Tens of millions per service (Roku ~90M accounts Q4 2025) |
| Living-room / CTV | #1 streaming on US TV screens (13.4%); TV = primary device; 1B+ hrs/day on TV | Mobile-first — limited TV app presence | Mobile/desktop-first — no native CTV presence | CTV-native — that is the entire product |
| Intent / search-adjacency | High — inside Google's intent graph (custom/in-market segments, your data) | Low — interest/behavior, trend-led | Low-mid — interest/behavior + social graph | Low — content/demographic, lean-back |
| Signature formats | Skippable/non-skippable in-stream, bumper, in-feed, Shorts, masthead, outstream, CTV non-skippable (30s) | In-Feed, TopView, Spark Ads — vertical 9:16 only | Feed/Stories/Reels video, in-stream, Advantage+ | 15s/30s standard spots, pause ads, home-screen placements |
| Performance / conversion product | Demand Gen (VAC retired); Performance Max cross-channel | Smart+ / Smart Performance | Advantage+ Shopping / Advantage+ campaigns | Limited — reach-first; some shoppable formats emerging |
| Measured outcome edge | 4.5× higher ROAS than other streaming TV (MMM, Brandcast 2025); view-through + engaged-view conv; Brand/Search Lift | Virality / engagement; rising social commerce | Retargeting precision at scale (Pixel/CAPI) | High completion / premium-content adjacency; limited attribution |
| Where it is bought | Google Ads (self-serve) + DV360 / reservation | TikTok Ads Manager | Meta Ads Manager | Each platform's DSP/direct sales + programmatic |
Sources: shared verified-facts file (YouTube ad reach ~2.53B / 244M US adults, full-funnel framing, search-adjacent intent, format lineup, Demand Gen); Nielsen "The Gauge," April 2026 (YouTube 13.4%, #1 streaming on US TV screens); Neal Mohan, YouTube 2025 annual letter (1B+ hrs/day on TV); Google/Brandcast 2025 (4.5× ROAS vs streaming TV); DataReportal, Jan 2025 (~2.53B ad reach). TikTok/Meta MAU and pure-CTV figures are vendor-cited approximations; TikTok/Meta product names per their Ads Manager documentation.
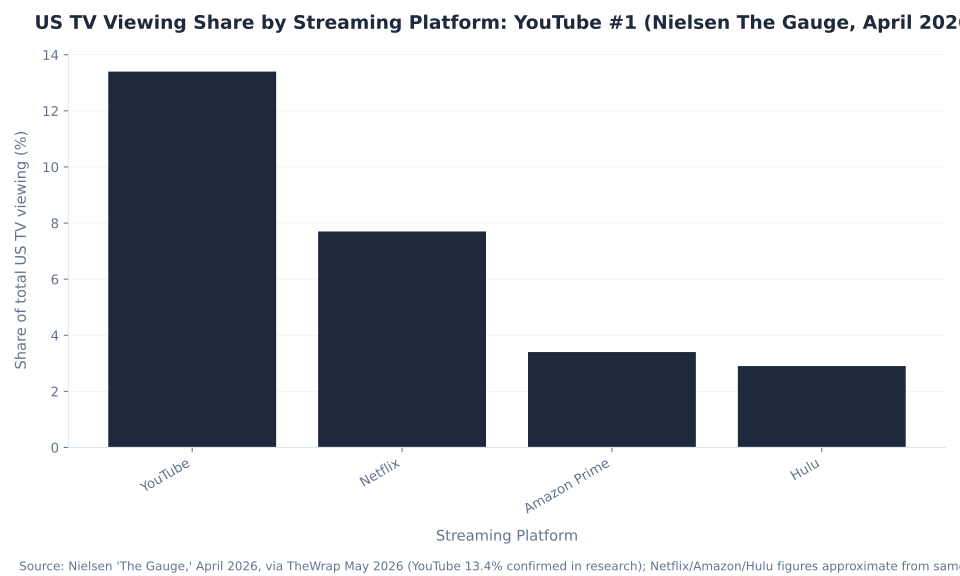
Three structural differences separate YouTube from the field. First, it sits inside Google's intent graph — every custom, in-market, and your-data segment in Google Ads is available on YouTube; TikTok and Meta target interest and behavior, not the same search-query structure. Second, it is the only platform here with significant TV-screen reach: 13.4% of all US TV viewing time (Nielsen, April 2026) makes it #1 on the living-room screen, ahead of Netflix (~7.7%), Amazon Prime (~3.4%), and Hulu (~2.9%). Third, it spans the complete funnel on a single buy — Video reach/views for awareness, Demand Gen for conversion (product feeds and shoppable CTV), and Performance Max for cross-channel ecommerce.
Each rival owns a distinct job: TikTok for short-form virality and Gen Z reach — CPM $6–$12 (Benly 2026), competitive but without the intent signal; Meta as the strongest social-graph retargeting machine; pure CTV for premium content adjacency and sports. MB Adv Agency's framework starts with the funnel job and the audience's mindset, not the headline CPM — and most serious plans run more than one, with YouTube as the anchor because it handles all four jobs on one buy.
Video Advertising Cost Comparison: YouTube vs TikTok vs Meta vs CTV
YouTube's CPV (~$0.01–$0.05 in-stream; ~$0.10–$0.30 Shorts) and CPM (~$5–$12 in-stream; $14.20–$18.50 CTV) sit at the lower end of the cost spectrum — its CTV CPM is ~40–60% below what Roku, Hulu, and Amazon charge for the same screen. But cost only means something next to what it buys. Full breakdown in how much YouTube ads cost.
| Metric | YouTube (YouTube-specific vendors) | TikTok | Meta (Facebook/Instagram) | Pure CTV (Roku/Hulu/Amazon) |
|---|---|---|---|---|
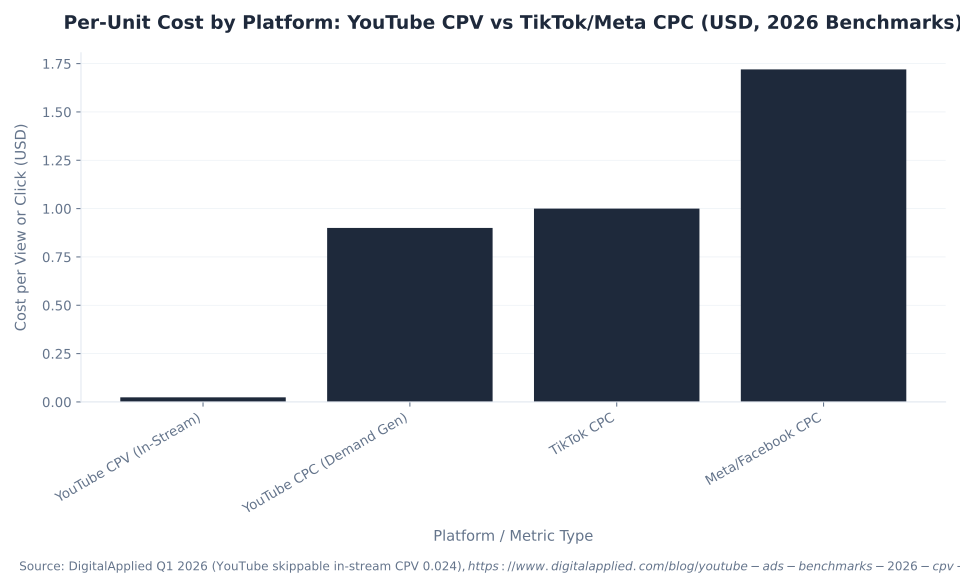
| CPV (cost per view) | In-stream: $0.024 (DigitalApplied) / avg $0.05 (AdConversion) / range $0.01–$0.19. Shorts: $0.10–$0.30 (Store Growers). CTV: $0.038 (DigitalApplied). | — (CPM/CPC-based; no native CPV buy) | — (CPM/CPC-based) | — (CPM / completed-view based; no CPV equivalent) |
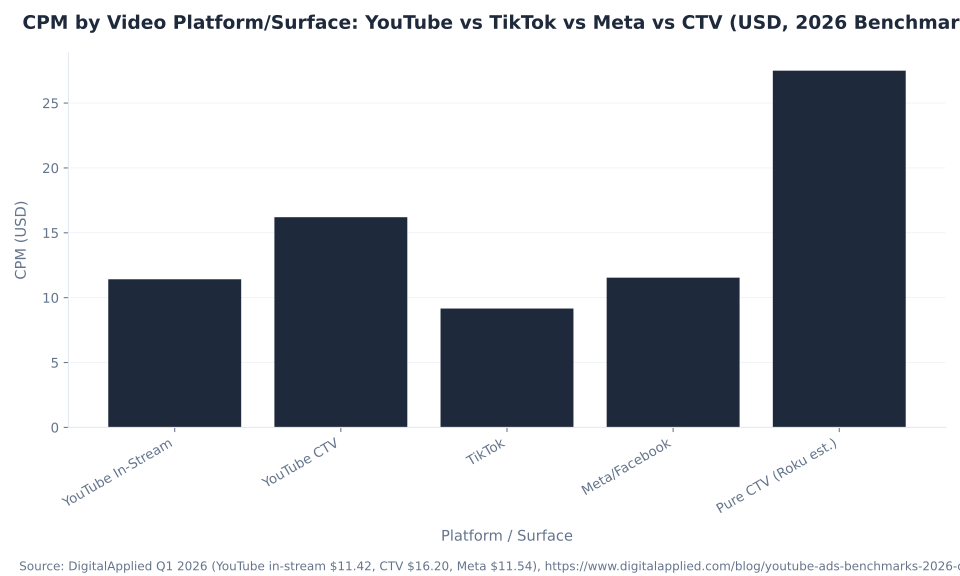
| CPM (cost per 1,000 impressions) | In-stream: $11.42 (DigitalApplied) / $5–$10 (Store Growers) / avg $9 (AdConversion). Shorts: $4.85 (DigitalApplied). CTV: $14.20–$18.50 (DigitalApplied). | ~$6–$12 (Benly 2026); ~$9.16 (WebFX 2026); ~$4.80 (Lebesgue) | ~$11.54 all-industry FB (DigitalApplied 2026); Reels ~$10–$12 (~25–35% below Feed ~$16) | $10–$60+ overall: Hulu ~$10–$30 / Roku ~$20–$35 / Amazon ~$25–$60 (Adsposure 2026); $15–$85 by industry (namediaexperts 2026) |
| CPC (action / performance) | Demand Gen: $0.30–$1.50 (Store Growers); avg $3.56 B2B-skewed (AdConversion — see note) | ~$0.50–$1.50 (Benly 2026); median ~$0.62 (AdLiftr) | ~$1.72 all-industry FB (DigitalApplied 2026); Reels CPC ~$1.28 (WebFX/Sovran 2026) | — (reach buy; no per-click model) |
| What the cost buys | Full-funnel reach + search-adjacent intent + the #1 CTV screen on one Google Ads buy | Short-form virality + the youngest audience + entertainment-native discovery | Massive social-graph reach + precise retargeting + Advantage+ Shopping scale | Premium living-room reach + high completion + sports/prestige content adjacency |
Sources: AdConversion (CPV avg $0.05; CPM avg $9; CPC avg $3.56 B2B-skewed; real $1.04M dataset); Store Growers 2026 (CPV $0.05 in-stream / $0.10–$0.30 Shorts; CPM $5–$10; Demand Gen CPC $0.30–$1.50); DigitalApplied Q1 2026 (CPV $0.024; CPM in-stream $11.42 / Shorts $4.85 / CTV $14.20–$18.50); Benly TikTok 2026 (CPM $6–$12; CPC $0.50–$1.50); WebFX 2026 (CPM ~$9.16); DigitalApplied Facebook 2026 (CPC $1.72; CPM $11.54); Adsposure 2026 (Hulu $10–$30; Roku $20–$35; Amazon $25–$60); namediaexperts 2026 ($15–$85 by industry). Different vendor methodologies — directional, not a single cross-platform study. WordStream/LocaliQ NOT used (Search-only). All third-party estimates, not rate cards; pure CTV has no CPV/CPC equivalent ("—").
The most important comparison here is YouTube CTV versus pure-CTV. YouTube CTV runs $14.20–$18.50 CPM (DigitalApplied Q1 2026) — so a brand buying Roku at its ~$27.50 mid CPM (Adsposure 2026) pays ~60% more per thousand impressions for the same living-room screen, and Amazon Prime Video's ~$42.50 mid is nearly 2.5× YouTube's CTV CPM — a gap that widens with YouTube's 4.5× ROAS edge over other streaming TV (MMM, Brandcast 2025).
The CPC comparison carries a critical caveat: YouTube's in-stream CPV ($0.024, DigitalApplied) and TikTok/Meta CPC ($0.50–$1.72) measure different outcomes — a CPV is a 30-second view, a CPC a click to a landing page. For a genuine performance-buy comparison, use YouTube Demand Gen CPC ($0.30–$1.50, Store Growers 2026) versus TikTok ($0.50–$1.50, Benly 2026) versus Meta ($1.72, DigitalApplied 2026) — YouTube competitive with TikTok and below Meta, while also delivering the CTV screen. Cost also differs by vertical — automotive and travel run differently than B2B/SaaS. MB Adv Agency's guidance: benchmark against the closest vertical and objective.
Formats, Intent, and Measurement: Why YouTube Is Structurally Different
Cost is the most commonly compared dimension across video platforms — and the least useful in isolation. What determines platform fit is how each targets buyers, what measurement it provides, and where its formats sit on the funnel. YouTube's format range is the widest of the four; its targeting is the only intent-based model here; and its measurement stack — view-through, engaged-view, Brand/Search Lift — is one the social feeds do not match.
| Capability | YouTube | TikTok | Meta (FB/IG) | Pure CTV |
|---|---|---|---|---|
| Format range | Widest — 6s bumper → 15s non-skip → 30s CTV non-skip → long-form skippable; Shorts 9:16; in-feed; masthead; outstream | Vertical 9:16 short-form only (In-Feed, TopView, Spark Ads) | Feed/Stories/Reels video + in-stream (multiple placements) | 15s/30s spots; pause ads; home-screen |
| Targeting model | Intent-rich — custom segments (keywords/URLs/apps), in-market, life events, your-data segments | Interest + behavioral + trend signals | Interest + behavioral + social graph + lookalikes | Content/demographic + some addressable data |
| Search-adjacency | Yes — inside Google's intent graph | Emerging in-app search; no Google graph connection | No search layer | No search layer (lean-back only) |
| Shopping / commerce | Product feeds in Demand Gen (+33% conv at similar CPA); shoppable CTV Jan 2026 ("buy on TV with Google Pay") | TikTok Shop; video shopping ads; commission-based affiliate | Advantage+ Shopping; Shops; dynamic product ads / catalog retargeting | Shoppable formats emerging (varies by platform) |
| Measurement stack | Google tag; view-through conv (VTC); engaged-view conv (EVC, ≥10s viewed); Brand Lift + Search Lift; GA4 import; Data-Driven Attribution (DDA) — only DDA + Last-Click remain (rules-based removed) | In-platform attribution + lift studies; limited cross-channel | Meta Pixel / CAPI; in-platform attribution; Advantage+ lift; cross-device | Completion rate; incrementality studies; limited lower-funnel attribution |
| Bought inside | Google Ads (self-serve) + DV360 / reservation (Masthead/Select) | TikTok Ads Manager | Meta Ads Manager | Platform DSP/direct sales + open programmatic |
Sources: shared verified-facts file (format lineup, targeting types, Demand Gen, product feeds +33% conv, shoppable CTV Jan 2026, VTC/EVC, Brand/Search Lift, DDA default); Google/Brandcast 2025 (4.5× ROAS vs streaming TV); TikTok Ads / Meta Ads documentation. NAMING PRECISION: conversion product = Demand Gen (NOT VAC, retired ~Apr 2025); formats = skippable in-stream / in-feed / Shorts (NOT "TrueView"); audiences = custom segments and your data; impression share is NOT a native YouTube/Video metric. Verify TikTok/Meta automation names at publish.
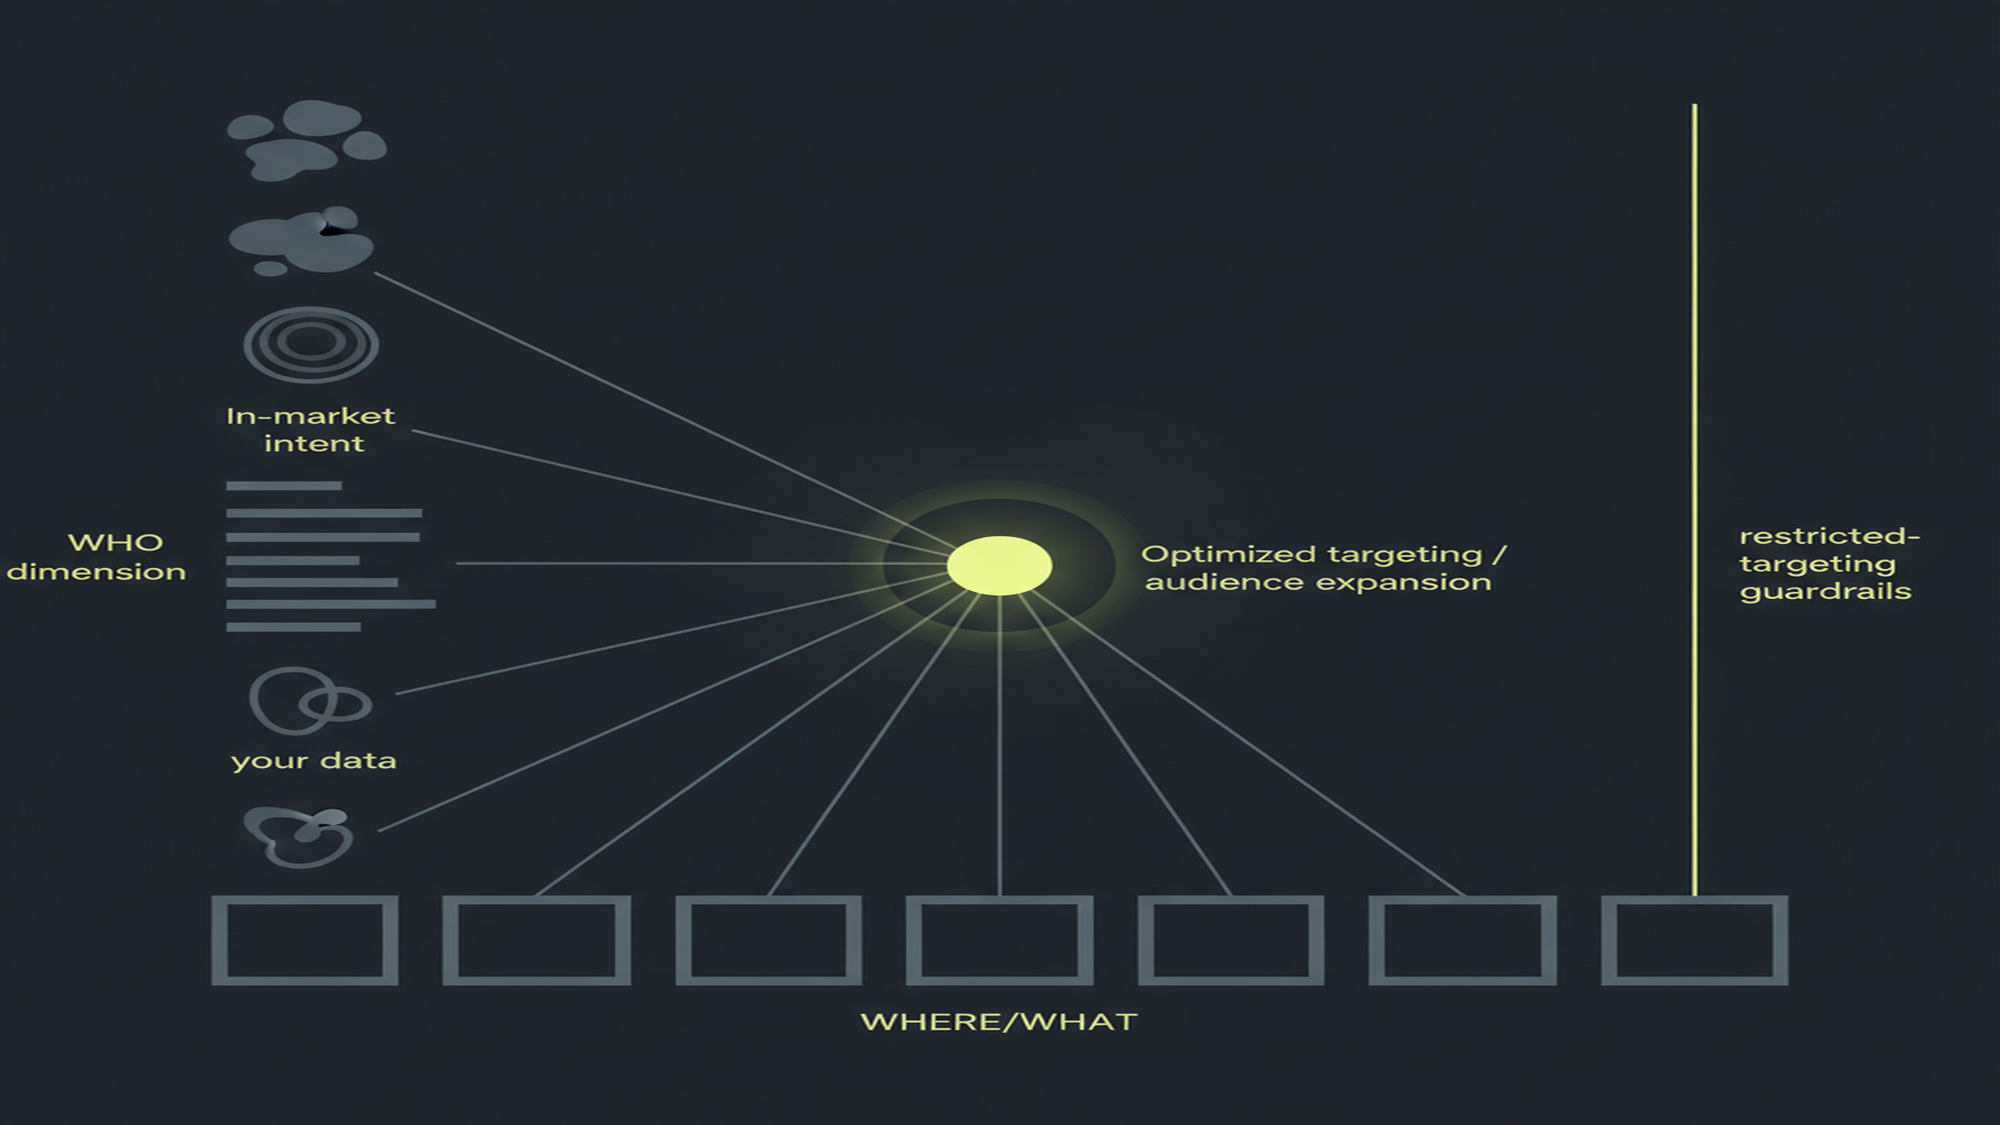
The targeting column is where YouTube separates most clearly. Its custom segments — built from keywords, URLs, and apps — give direct access to Google's search-query and purchase-intent graph: a brand can target people evaluating a category by competitor keywords and research-intent URLs. Neither TikTok nor Meta sits inside that graph. ("Similar audiences" were removed in August 2023; the current equivalents are optimized targeting and audience expansion.) See YouTube ads optimization and AI.
YouTube's ad format lineup is the widest here: 6-second bumpers; skippable in-stream; non-skippable in-stream (up to 15s, plus a separate 30-second non-skippable CTV tier); in-feed video ads (renamed from "TrueView Discovery," November 2021); Shorts ads (vertical 9:16); outstream; and reserved Masthead placements. Overlay ads and Sponsored cards are discontinued — not live formats.
CPM by Video Platform/Surface: YouTube vs TikTok vs Meta vs CTV (USD, 2026 Benchmarks)
Which Video Advertising Platform Is Right for You: The Decision Matrix
Platform choice is a question of which platform fits the goal, not which "wins." The matrix below maps goals and scenarios to the platform most likely to deliver, grounded in each platform's structural strengths.
| Your goal / scenario | Lean toward | Why |
|---|---|---|
| Full-funnel video — awareness through conversion on one buy | YouTube | Only platform combining scale + CTV + search-adjacent intent + Demand Gen conversion in one Google Ads buy |
| Living-room / CTV reach efficiently | YouTube (anchor) + pure CTV for premium content adjacency | #1 streaming on US TV screens at CTV CPM $14.20–$18.50 vs pure-CTV $25–$65; 4.5× ROAS vs streaming TV |
| Reach high-intent buyers who research before purchasing | YouTube | Search-adjacency + custom/in-market segments; 81% say creators help them research products (Brandcast 2025) |
| Short-form virality / Gen Z audience | TikTok (+ YouTube Shorts for incremental reach) | Entertainment-native virality + youngest active audience; Shorts adds short-form reach inside Google's ecosystem |
| Retargeting a warm social-graph audience at scale | Meta | Largest social graph (~3B+ FB / ~2B+ IG) + most precise interest/behavioral targeting + Advantage+ Shopping retargeting machine |
| Prestige living-room / live-sports adjacency, brand campaigns | Pure CTV (Roku/Hulu/Amazon) + YouTube CTV as efficient reach layer | Premium content adjacency + high forced-view completion; YouTube adds cheaper incremental CTV reach |
| Lowest cost per video view at volume | YouTube | Skippable in-stream CPV ~$0.01–$0.05 — lowest per-view of the four; deep auction + widest format range |
| DTC ecommerce — shoppable video + product feed integration | YouTube + Meta | YouTube Demand Gen product feeds (+33% conv at similar CPA) + shoppable CTV; Meta Advantage+ Shopping for catalog retargeting and social ROAS |
Sources: shared verified-facts file (full-funnel/Demand Gen, search-adjacent intent, CTV #1, product feeds +33% conv, shoppable CTV Jan 2026); Google/Brandcast 2025 (4.5× ROAS; 81% research stat); DigitalApplied Q1 2026 (YouTube CTV CPM $14.20–$18.50 vs pure-CTV $25–$65); Benly/WebFX (TikTok cost + youngest audience); DigitalApplied Facebook 2026 (Meta scale). These are conditional leans by goal, not absolute winners — the mature plan runs more than one platform, YouTube as the full-funnel anchor.
The most common error is comparing CPV against CPM and treating the cheapest per-unit cost as "best." A $0.024 CPV is a 30-second view from someone who chose not to skip; a $9.16 CPM on TikTok in-feed buys 1,000 scroll-by impressions. MB Adv Agency's guidance: match the metric to each platform's native value, then judge platforms by how well they execute it for the goal.
For DTC and ecommerce brands, the strongest case for anchoring on YouTube is product feeds and shoppable CTV. Demand Gen with linked Google Merchant Center feeds drives on average +33% conversions at similar CPA (Google), and shoppable CTV (January 2026 Demand Gen Drop) lets viewers buy from the TV screen. The ecommerce PPC agency framework finds product-feed Demand Gen outperforms awareness-only buys on conversion volume — especially in fashion and consumer goods.
For B2B and SaaS software advertisers, YouTube's search-adjacent intent and Demand Gen targeting make it the strongest video conversion surface — TikTok skews young, and Meta's B2B targeting lacks a search layer. The B2B PPC agency framework treats YouTube as the primary video surface for B2B lead generation for exactly this intent-layer advantage.
Per-Unit Cost by Platform: YouTube CPV vs TikTok/Meta CPC (USD, 2026 Benchmarks)
YouTube's Connected TV Advantage: Scale, Cost, and ROAS
YouTube is the most-watched streaming platform on US TV screens — not just among "social video," but overall in the Nielsen Gauge, which measures all US TV viewing (broadcast, cable, and streaming combined). That position changes how YouTube fits a CTV media plan.
| Metric | Figure | Source |
|---|---|---|
| YouTube share of total US TV viewing | 13.4% — #1 streaming platform on US TV screens; #1 for ~3 years | Nielsen "The Gauge," April 2026 (via TheWrap May 2026) |
| Netflix share of total US TV viewing (approx.) | ~7.7% [Operator verify from TheWrap/Variety May 2026 Gauge article] | Nielsen "The Gauge," April 2026 (same report — verify at publish) |
| Americans watching YouTube on CTV monthly | 150M+ | Google, 2025 |
| Hours watched on TV screens daily | 1 billion+ | Neal Mohan, YouTube CEO 2025 annual letter (blog.youtube) |
| Primary viewing device for YouTube in US | TV screens (surpassed mobile by watch time) | Neal Mohan, YouTube CEO 2025 annual letter |
| YouTube CTV ad conversion growth (YoY) | +200%+ (Q1 2025 → Q1 2026) | Google / Brandcast 2026 |
| YouTube ROAS vs other streaming TV | 4.5× higher | MMM data, Google / Brandcast 2025 |
| YouTube CTV CPM | $14.20–$18.50 (composite mid $16.20) | DigitalApplied Q1 2026 |
| Roku CPM range | $20–$35 (mid ~$27.50) | Adsposure 2026 US Media CPM Benchmark |
| Hulu CPM range | $10–$30 (mid ~$20.00) | Adsposure 2026 US Media CPM Benchmark |
| Amazon Prime Video CPM range | $25–$60 (mid ~$42.50) | Adsposure 2026 US Media CPM Benchmark |
| Pure CTV full-industry CPM range | $15–$85 by industry | namediaexperts CTV CPM Benchmarks 2026 |
Sources: Nielsen "The Gauge," April 2026 (via TheWrap May 2026) — YouTube 13.4% confirmed; Netflix/Hulu/Amazon shares approximate from the same report (verify at publish). Google/Brandcast 2025/2026 (4.5× ROAS; 150M+ US CTV monthly; CTV conversions +200%+ YoY). Neal Mohan 2025 annual letter (1B+ hrs/day on TV; TV = primary US device). DigitalApplied Q1 2026 (YouTube CTV CPM $14.20–$18.50; mid $16.20). Adsposure 2026 (Roku $20–$35; Hulu $10–$30; Amazon $25–$60). namediaexperts 2026 ($15–$85 by industry). Third-party estimates, not rate cards; different vendors for YouTube vs pure-CTV — directional, not single-methodology.
The critical misunderstanding this corrects: a plan that buys "connected TV" as Roku, Hulu, and Amazon while treating YouTube as a social/mobile option is excluding the largest CTV platform from the CTV buy. YouTube's 13.4% share covers all TV viewing time — broadcast and cable included — ahead of Netflix (~7.7%), Amazon (~3.4%), and Hulu (~2.9%). Leaving it out drops the #1 platform and pays 40–60% higher CPM on the ones kept in.
Shoppable CTV adds another dimension: the January 2026 "Demand Gen Drop" lets viewers buy on the TV screen via Google Pay — a format pure-CTV has not matched at scale, and CTV ad conversions grew over 200% YoY from Q1 2025 to Q1 2026 (Brandcast 2026). The combination of #1 CTV share, lower CPM ($14.20–$18.50 vs $25–$65), 4.5× ROAS, and shoppable formats makes YouTube the primary CTV buy for performance brands — with pure-CTV as a premium supplement.
US TV Viewing Share by Streaming Platform: YouTube #1 (Nielsen The Gauge, April 2026)
YouTube's Intent Advantage: The Only Video Platform Inside Google's Search Graph
The intent gap between YouTube and the other platforms is structural. TikTok and Meta are entertainment-interruption surfaces; pure CTV is lean-back, long-form. YouTube is different: people come to search, research, compare, and decide — and advertisers target that active-research moment through Google's intent graph.
| Metric | Figure | Source |
|---|---|---|
| US viewers who say YouTube creators help them research/discover products when shopping | 81% | Google / Brandcast 2025 |
| Brand search lift when a creator mentions a product | 13× more likely to search the brand | Google internal, n=60, Feb 2026, Brandcast 2026 |
| Purchase lift when a creator mentions a product | 5× more likely to buy | Google internal, n=60, Feb 2026, Brandcast 2026 |
| Targeting type capturing active search intent on YouTube | Custom segments (keywords, URLs, apps) — available on Google/YouTube, not TikTok/Meta/CTV | Google Ads documentation / shared verified-facts §4 |
| In-market segments (active purchase research signals) | Available on YouTube / Google Ads; no equivalent on TikTok / pure CTV | Google Ads Audience Manager, 2026 |
| Your-data segments on YouTube (channel viewers, site visitors) | Available (channel-Ads link required; ≥100 active users; membership up to 540 days) | Google Ads documentation / shared verified-facts §4 |
| Demand Gen Lookalike segments (current — distinct from deprecated "similar audiences") | Narrow ~2.5% / Balanced ~5% / Broad ~10% of geo; min seed 100 matched members | Google Ads documentation, 2026 (Demand Gen only) |
Sources: Google/Brandcast 2025 (81% research stat); Google internal n=60, Feb 2026 / Brandcast 2026 (13× brand search lift; 5× purchase lift); Google Ads Audience Manager documentation (custom segments, in-market, your data, Demand Gen Lookalike segments). IMPORTANT: "similar audiences" were removed from all campaigns August 2023 — not a current option; Demand Gen Lookalike segments are a separate, current feature. "Custom affinity" and "custom intent" merged into "custom segments" in 2021.
YouTube's custom segments are built from the same signals that drive Google Search — keywords, URLs, and apps. A SaaS advertiser can build a segment around competitor product names and "best [category] software" terms, then serve video ads to people researching that category right now. TikTok's interest and behavioral targeting works for discovery but reads past behavior, not active research intent. Pure CTV has no search layer at all.
81% of US viewers say YouTube creator content helps them research and discover products when shopping (Brandcast 2025), and when creators discuss products viewers are 13× more likely to search the brand and 5× more likely to buy (Google internal, n=60, Feb 2026). That is search-adjacent purchase intent in a video context — a structural advantage no entertainment feed replicates.
The behavioral evidence matches what the targeting enables: high-consideration categories — legal, B2B software, financial, automotive, home improvement — produce the strongest video ROI on YouTube, because the audience is in a buying-consideration mindset, not a passive-entertainment one. For legal service and software advertisers with high-value conversions, that intent layer justifies YouTube as the primary video channel even when TikTok or Meta shows a lower CPM on paper.
YouTube vs TikTok: When Each Platform Wins
YouTube and TikTok are structurally different ad environments — and the difference runs deeper than short-form versus long-form. TikTok owns entertainment-native discovery, virality, and the youngest active audience; YouTube owns intent, the living-room screen, and the complete funnel. Both belong in a video plan. The head-to-head below maps where each wins.
| Dimension | YouTube | TikTok |
|---|---|---|
| Audience / reach | Ad reach ~2.53B (DataReportal); 244M US adults | ~1.5B+ global (vendor-cited); youngest active audience |
| CPM | In-stream $11.42; Shorts $4.85 (DigitalApplied Q1 2026) | ~$9.16 (WebFX 2026); $6–$12 (Benly 2026) |
| CPC (performance) | Demand Gen $0.30–$1.50 (Store Growers) | $0.50–$1.50 (Benly); median ~$0.62 (AdLiftr) |
| Targeting / intent | Intent-rich — custom segments inside Google's search graph | Interest + behavioral + trend signals; no Google graph |
| Short-form format | Shorts 9:16 — 200B daily views (Neal Mohan, Cannes June 2025) | In-Feed, TopView, Spark Ads — vertical 9:16 native |
| Living-room / CTV | #1 streaming on US TV screens (13.4%, Nielsen April 2026) | Mobile-first — limited TV-app presence |
| When it wins | Living-room screen, high-consideration intent, full-funnel on one Google Ads buy, B2B/SaaS lead gen | Gen Z virality, trend-native brand discovery, entertainment-first short-form |
Sources: Benly TikTok Cost 2026 (CPM $6–$12; CPC $0.50–$1.50); WebFX 2026 (TikTok CPM ~$9.16); DigitalApplied Q1 2026 (YouTube in-stream $11.42; Shorts $4.85); Store Growers 2026 (Demand Gen CPC $0.30–$1.50); DataReportal Jan 2025 (~2.53B ad reach); Nielsen "The Gauge," April 2026 (13.4%). TikTok figures and AdLiftr median ($0.62) are vendor-cited estimates, not official rate cards.
The practitioner split: TikTok leads when the brief is Gen Z virality, trend-native discovery, or entertainment-first short-form. YouTube leads when it includes the living-room screen, high-consideration purchase intent, full-funnel conversion on a single Google Ads buy, or B2B/SaaS lead generation. Most mature DTC brands run both — TikTok for virality and Gen Z acquisition, YouTube Demand Gen for intent-based conversion and shoppable CTV — and YouTube Shorts (CPM $4.85) plus TikTok form a complete short-form stack, not a binary choice. For food and beverage and CPG brands, TikTok Shop and YouTube shoppable CTV are complementary commerce surfaces.
YouTube vs Meta Video and Reels: Intent and CTV vs Social-Graph Retargeting
Meta's video ad environment is the most powerful social-graph retargeting machine here — and the platform most likely to run alongside YouTube in a mature video plan. The question is not YouTube or Meta; it's what job each does and how to measure each on its own terms.
Facebook (~3B+ MAU) and Instagram (~2B+ MAU; Meta earnings, vendor-approximate) combine for the largest social audience here. Advantage+ Shopping, dynamic product ads, and catalog retargeting make Meta the strongest platform for social-graph retargeting at scale — reaching people who visited a site, engaged with a post, purchased before, or match a lookalike across both apps. For ecommerce brands, Advantage+ Shopping is often the highest-ROAS retargeting channel in a multi-platform mix.
Meta's Reels CPM runs ~25–35% below the standard Facebook Feed (~$16 CPM), putting it at ~$10–$12 with CPC ~$1.28 (WebFX / Sovran 2026) — cost-competitive with TikTok in-feed and YouTube Shorts. Meta all-industry CPC averages $1.72 (DigitalApplied 2026), above YouTube Demand Gen's DTC range ($0.30–$1.50).
The gaps Meta cannot close against YouTube: search-adjacent intent and the living-room screen. Meta has no search layer — it reaches people by social behavior, interests, and demographics, not active research intent — and has no comparable TV-screen presence. The mature plan treats YouTube as the intent+CTV anchor and Meta as the social-graph retargeting layer, each measured on its native metric — for ecommerce brands, Demand Gen product feeds on YouTube plus Meta Advantage+ Shopping for social retargeting, measured independently.
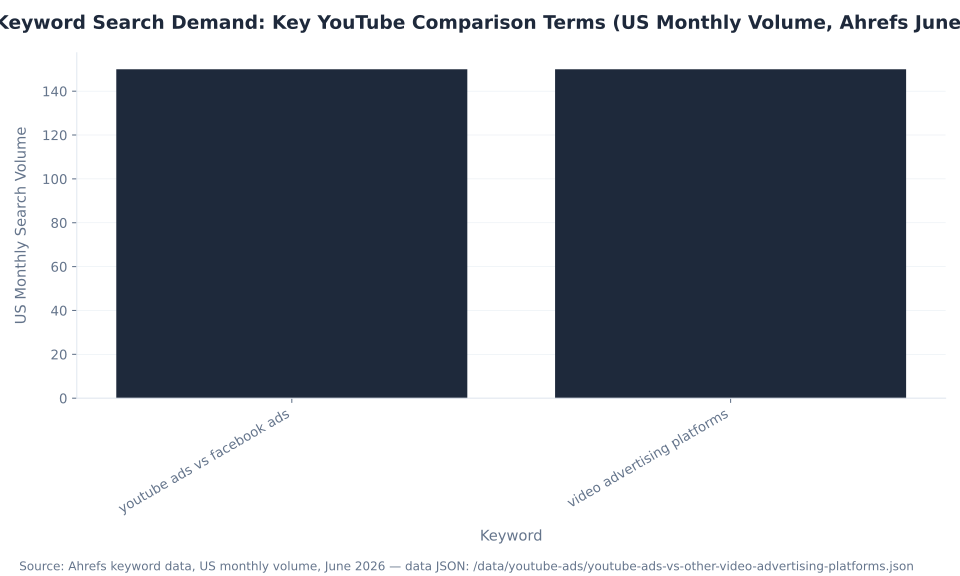
Keyword Search Demand: Key YouTube Comparison Terms (US Monthly Volume, Ahrefs June 2026)
VIDEO ADVERTISING PLATFORM STRATEGY
Not Sure Whether YouTube Belongs in Your Video Mix Alongside TikTok, Meta, and CTV?
YouTube, TikTok, Meta, and pure CTV each do a different job in a video plan. We help advertisers decide which platforms earn a place, how to split the budget across the funnel, and how to measure each on its own metric rather than forcing apples-to-oranges CPM comparisons. YouTube ads run inside Google Ads — so platform selection is a Google-native media planning question that connects directly to your Search and Shopping strategy.
Get a Video Platform Strategy Consult →YouTube vs Pure CTV: Roku, Hulu, and Amazon — What Each Does That the Other Doesn't
YouTube dominates US TV-screen viewing by share, but pure-CTV platforms (Roku, Hulu, Amazon Prime Video) serve a distinct use case: premium content adjacency, captive forced-view completion, and live-sports adjacency — and for certain brand campaigns, that premium context justifies the CPM premium.
Their structural advantage is content adjacency and forced-view completion. Hulu, Roku, and Amazon Prime Video sell ads adjacent to premium licensed content — scripted series, live sports, original programming — with non-skippable mid-roll that delivers very high completion. A brand buying Hulu mid-roll next to a scripted drama, or Amazon Thursday Night Football, pays the Adsposure CPM range ($10–$30 Hulu, $25–$60 Amazon) for an association YouTube's open-content model does not provide at scale. When the brief specifies "our brand next to X show or X live sport," pure CTV is the right tool.
Pure-CTV CPMs run $10–$60+ across Roku, Hulu, and Amazon, reaching $15–$85 by industry (Adsposure 2026; namediaexperts 2026). YouTube CTV CPM is $14.20–$18.50 (DigitalApplied CTV 2026) — and YouTube is #1 on US TV screens. The correct stack for most performance brands: YouTube as the efficient-reach anchor, pure CTV for specific premium contexts.
Where pure CTV falls short: measurement, cost, and reach. Its attribution is incrementality- and completion-based — strong for awareness, weaker for conversion. Roku active accounts stand at ~90M (Q4 2025 earnings); Hulu and Amazon serve tens of millions — all below YouTube's 150M+ US CTV monthly viewers (Google, 2025). Pure-CTV inventory is bought through platform DSPs, separate from Google Ads, so there is no unified stack connecting CTV exposure to Search, Shopping, and Demand Gen conversion. A Google Ads audit can connect YouTube CTV exposure to downstream conversion via view-through, engaged-view, and Brand/Search Lift.
MB Adv Agency's guidance for brands weighing pure CTV alongside YouTube: use YouTube CTV as the efficient-reach foundation (lower CPM, more US viewers, full measurement, 4.5× ROAS), then layer pure-CTV for premium contexts where programming association matters — tentpole events, live sports, prestige content. That captures YouTube's scale plus pure CTV's content-adjacency premium without overpaying for impressions where adjacency is not the priority.
4 Video Advertising Misconceptions This Comparison Corrects
The most consequential mistakes in video platform decisions come from outdated framing or category confusion — not bad judgment. Here are the four most damaging misconceptions, each corrected with 2026 verified facts.
Misconception 1: "YouTube is just pre-roll — for real performance you go to Meta or TikTok." That is 2018 framing on a 2026 platform. YouTube's conversion product is Demand Gen, which replaced Video Action Campaigns. It runs across in-stream, in-feed, Shorts, Discover, Gmail, and Maps with Smart Bidding, supports product feeds (+33% conversions at similar CPA, Google), and includes shoppable CTV (January 2026). Demand Gen CPC for DTC runs $0.30–$1.50 (Store Growers 2026) — competitive with TikTok, below Meta. The PPC campaign management framework treats it as a full-funnel product, not an awareness-only buy.
Misconception 2: "YouTube's ad revenue was $60 billion in FY2025." The $60B figure is YouTube's FY2025 total — ads plus ~$19–$20B subscriptions. Ad revenue alone was about $40.37 billion (Tubefilter, February 5, 2026), up 10.7% YoY in Q1 2026. Citing $60B as "ad revenue" overstates the ad business by ~50%. Use $40.37B when sizing the advertising platform against TikTok or Meta.
Misconception 3: "Connected TV means Roku, Hulu, and Amazon — YouTube is the mobile/desktop option." The inverse is true. YouTube is the #1 streaming platform on US TV screens — 13.4% of total US TV viewing (Nielsen "The Gauge," April 2026), #1 for about three years, with TV now the primary device by watch time (Neal Mohan, 2025 annual letter). A plan that buys Roku, Hulu, and Amazon while excluding YouTube drops the largest CTV platform — and pays 40–60% more CPM for the same screen, with less measurability.
Misconception 4: "Video Action Campaigns / TrueView for action are how you run YouTube performance." Both are retired: "TrueView for action" → Video Action Campaigns → Demand Gen. "TrueView in-stream" is now skippable in-stream ads and "TrueView Discovery" is now in-feed video ads (renamed November 2021); the only surviving "TrueView" term is the "TrueView views" metric. Impression share is not a native YouTube/video metric. A Google Ads audit surfacing VAC or TrueView as current is reading historical rows, not the live 2026 lineup.
Frequently Asked Questions: YouTube vs Other Video Advertising Platforms
Ready to Build a Multi-Platform Video Plan Anchored on YouTube?
YouTube ads run inside Google Ads — so deciding where video fits is a Google-native media planning question. Explore our PPC services or talk to our team for a platform-fit conversation that covers YouTube, TikTok, Meta, and CTV in one strategic framework.
Book a Platform Strategy Consult → See Campaign Management →Methodology
All benchmark figures are attributed to named third-party vendors: YouTube from AdConversion, Store Growers, and DigitalApplied Q1 2026; TikTok from Benly and WebFX; Meta from DigitalApplied; pure CTV from Adsposure and namediaexperts. Different vendors anchor different columns — figures are directional, not a single-methodology study. Platform-scale figures from Nielsen "The Gauge" April 2026, DataReportal Jan 2025, Google/Brandcast 2025–2026, and Neal Mohan's annual letters; ad revenue from Tubefilter Feb 5 2026; keyword data from Ahrefs US June 2026. No mbadv client metrics used anywhere. Reviewed by MB Adv Agency, June 2026.
YouTube has emerged as a dominant force in the realm of digital marketing, particularly when it comes to video advertising. With millions of creators and billions of hours of content, it offers a unique blend of reach, engagement, and scalability. In this article, we will explore how YouTube ads stack up against other video advertising platforms, including Meta Ads and traditional TV advertising. We will also discuss the strengths of YouTube when it comes to storytelling and highlight various use cases for video-first strategies.
YouTube Ads vs. Other Video Advertising Platforms
When discussing video advertising, it's crucial to consider the unique characteristics of various platforms. YouTube stands out due to its massive audience, diverse content types, and sophisticated targeting options. Advertisers have the ability to reach specific demographics and tailor ad content based on viewer behavior and interests. This level of customization allows brands to create more relevant and engaging ads that resonate with their target audience, ultimately leading to higher conversion rates. Furthermore, YouTube's integration with Google Ads enables advertisers to leverage search data, enhancing their ability to reach potential customers at the right moment.

Comparatively, platforms like Meta (formerly Facebook) offer different advantages. While Meta Ads provide precise targeting based on user data across its social networks, including Instagram, they often struggle to deliver the same high-quality video experience that YouTube provides. Additionally, Meta's video ads typically appear within users' newsfeeds, which can lead to lower engagement rates than what YouTube experiences, where viewers actively seek video content. This difference in user intent is significant; on YouTube, users are often in a more receptive state for video consumption, allowing brands to deliver their messages more effectively. Moreover, the interactive features available on YouTube, such as clickable links and calls to action, further enhance viewer engagement and drive traffic to advertisers' websites.
Traditional TV advertising, on the other hand, has been a long-standing method of brand promotion. The vast reach of television can be beneficial for brand awareness; however, it lacks the interactivity and personalized targeting that digital platforms like YouTube offer. Furthermore, the high cost of TV ad placements can be prohibitive for many advertisers, especially small businesses. In contrast, YouTube provides a more democratized advertising landscape, where even smaller brands can compete for attention through targeted campaigns without breaking the bank. This accessibility has led to a surge in content creation from diverse brands, enriching the platform's ecosystem.
Comparison with Meta Ads and Traditional TV Advertising
In comparing YouTube ads with Meta Ads and traditional TV ads, one of the critical metrics to examine is the cost-effectiveness of each platform. YouTube operates under a pay-per-click (PPC) or pay-per-view (PPV) model, allowing advertisers to maximize their return on investment (ROI) by focusing on engaged viewers. Conversely, traditional TV advertising often requires substantial upfront costs without the guarantee of consumer engagement. Additionally, the ability to run targeted campaigns on YouTube means that advertisers can allocate their budgets more efficiently, reaching audiences that are more likely to convert, rather than casting a wide net that may not yield satisfactory results.
Moreover, YouTube’s extensive analytics dashboard provides advertisers with real-time data regarding ad performance, allowing for quick adjustments to campaigns. Meta Ads do offer insights, but their analytics can lack the depth and clarity that YouTube provides, particularly in viewer behavior analysis. This data-driven approach empowers advertisers to refine their strategies continuously, optimizing their content based on what resonates most with viewers. Another aspect is the creative flexibility that YouTube offers. Advertisers can produce various video lengths and formats, from short skippable ads to longer content-rich videos. In contrast, traditional TV ads usually have strict time limits and formats that can restrict creative expression. This flexibility not only allows for more innovative storytelling but also enables brands to experiment with different styles and messages, fostering a more dynamic advertising environment.
Strengths of YouTube for Storytelling
YouTube's platform is designed with storytelling in mind. The ability to create engaging narratives through compelling video content is one of YouTube's most powerful strengths. Unlike traditional advertising, which may have a more ham-fisted approach to messaging, YouTube invites brands to weave stories that connect emotionally with viewers. This emotional connection is vital in today's marketing landscape, where consumers are increasingly seeking authenticity and relatability from the brands they support.

This ability to tell stories is amplified by the platform's interactive features. For instance, brands can utilize comments, shares, and likes to generate discussions and communities around their content. This helps in building a more profound relationship with the audience, as viewers feel more connected to brands that tell relatable stories. Additionally, the comment sections can serve as a valuable feedback loop, allowing brands to gauge audience reactions and adapt their storytelling techniques accordingly, fostering an environment of continuous improvement and engagement.
Furthermore, the variety of formats available on YouTube—ranging from vlogs and tutorials to live streams and interactive content—allows brands to experiment with different storytelling techniques. This versatility can lead to innovative marketing strategies that resonate well with viewers and don't come across as typical advertisements. For example, brands can create serialized content that keeps viewers coming back for more, or they can leverage user-generated content to enhance authenticity and community involvement, making the storytelling process a collaborative effort.
Use Cases for Video-First Strategies
Adopting a video-first strategy can serve various business objectives across different industries. For instance, e-commerce brands can leverage YouTube ads to showcase their products through unboxing videos, customer testimonials, or how-to guides, allowing consumers to see products in action before making a purchase. This not only helps in building trust but also provides a more immersive shopping experience that static images and text cannot achieve.
- Brand Awareness: Video-first strategies can focus on broadening consumer recognition through eye-catching ads and engaging video content. Creative storytelling can transform a brand's identity, making it memorable and relatable.
- Product Demonstrations: For tech products or complex services, video can help demystify offerings and clarify value propositions. This is particularly effective in industries where understanding product functionality is crucial for customer decision-making.
- Community Engagement: Companies can foster a loyal community by engaging their audience through Q&A sessions, tutorials, and interactive live streams. This two-way communication not only strengthens brand loyalty but also empowers consumers to feel like they are part of the brand's journey.
Moreover, educational institutions can utilize YouTube to create informative video content that highlights programs, interviews with faculty, and student testimonials, providing prospective students with valuable insights. This approach not only showcases the institution's offerings but also humanizes the brand, allowing potential students to envision themselves as part of the community. By sharing success stories and experiences, educational institutions can effectively attract and retain students in a competitive market.
In addition to these use cases, non-profit organizations can harness the power of YouTube storytelling to raise awareness about social issues and mobilize support for their causes. By sharing compelling narratives that highlight the impact of their work, these organizations can inspire action and foster a sense of community among supporters. The visual nature of video allows for a more profound emotional appeal, making it an essential tool for advocacy and fundraising efforts.

As a Google Ads expert, I bring proven expertise in optimizing advertising campaigns to maximize ROI.
I specialize in sharing advanced strategies and targeted tips to refine Google Ads campaign management.
Committed to staying ahead of the latest trends and algorithms, I ensure that my clients receive cutting-edge solutions.
My passion for digital marketing and my ability to interpret data for strategic insights enable me to offer high-level consulting that aims to exceed expectations.
Google Partner Agency
We're a certified Google Partner Agency, which means we don’t guess — we optimize withGoogle’s full toolkit and insider support.
Your campaigns get pro-level execution, backed by real expertise (not theory).

4.9 out of 5 from 670+ reviews on Fiverr.
That’s not luck, that’s performance.
Highly recommend Matteo to set up your server side tracking. He has a deep understanding of e-commerce tracking and will go above and beyond to make sure everything is set up correctly and working 100%. If you are scaling your store this set up is non-negotiable in my opinion and there isn't many people who have this much knowledge or put the effort in to get it right. Thanks again!

avorodesign.com
I can only recommend Matteo! He was very patient, professional and very knowledgeable about GA4, Consent Mode v2, and GDPR compliance. Communication was clear, and the setup was done professionally and efficiently. Highly recommend him for anyone needing reliable tracking implementation.

www.natureiki.life
Matteo shines in the realm of online professionals. His work is not only deep in data but also complemented by his proactive communication and cooperation, setting a new standard for freelancers. If you want someone who truly exceeds expectations, look no further. Highly recommended!

www.omanbeverlysmyth.com
Exceptional Service Beyond Expectations - Outstanding Service Impeccable depth, flawless delivery, and exceptional language fluency—this service exceeded all expectations. Highly recommended. Matteo truly ROCKS!!!

ium-paris.com
Top-notch, always highly value working with Matteo. An absolute Google Ads Genius. This is approximately the 8th time I have hired him and he's helped us get 6-7 ROAS. We are excited in continuing to improve our lead flow. Hire this guy if you need Google Ads help. Thanks Matteo!

www.dleeventgroup.com
I finally found the guy who can setup server side tracking and all the ecosystem properly. I definitely recommend Matteo. He is very responsive, kind and wants to dig into things. He configured GA4, Meta, Google Ads, Outbrain and google consent v2 with Cookiebot. Thanks Matteo.

inomega.fr
MB Adv delivered exceptional work with outstanding professionalism and lots of patience, taking time to see effects of changes made and not just do the work and submit it. The proactive communication and video summaries of the work completed made working with Matteo a pleasure, as he consistently went above and beyond. Highly recommended for web analytics projects! We are already working on another project.

www.withnellsensors.co.uk
Working with Matteo on my Google Ads was a game-changer. He's not just a strategist, he's a true partner. He understood my goals and tailored a campaign that perfectly reached my target audience. I'm grateful for his expertise and dedication.

dccargo.com
Click-driven mind
with plastic-brick obsession.
We build Google Ads campaigns with the same mindset we use to build tiny brick worlds: strategy, patience, and zero tolerance for wasted pieces.
Data is our blueprint. Growth is the only acceptable outcome.