
How to Track SEO Performance in Search Console

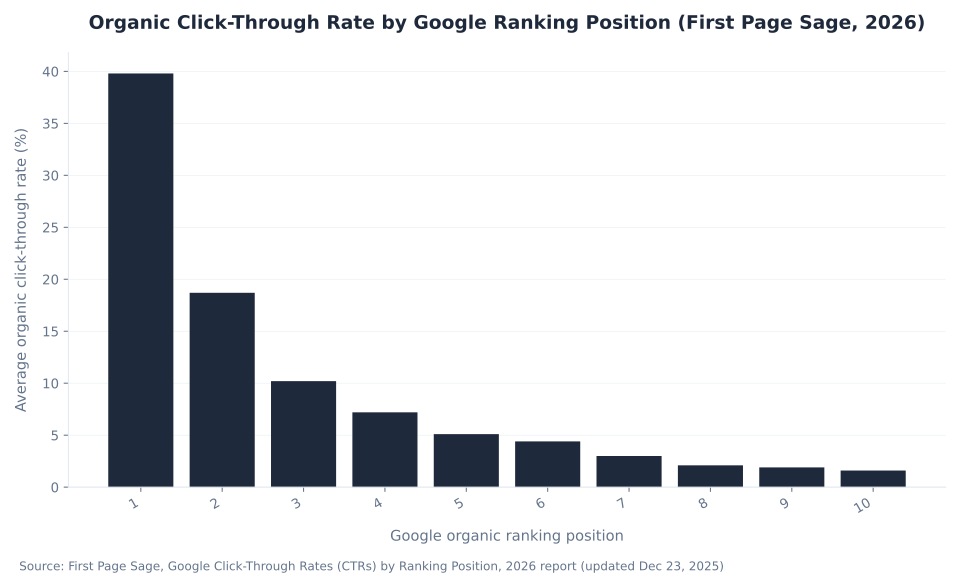
Organic CTR at position 1 — First Page Sage, 2026
39.8%
The average click-through rate for the top organic result — a number that collapses to 1.6% by position 10, with the top three positions taking about 68.7% of all clicks. That steep drop is why “average position” in Search Console is a metric worth tracking, and why this guide starts by teaching you which tool produces which number.
Source: First Page Sage, 2026 (updated Dec 23, 2025) — a meta-analysis estimate, not Google data and not your own Search Console CTR.
Why Measuring SEO Doesn’t Come With an Ad Dashboard
Paid search hands you a single dashboard: open Google Ads and you see spend, clicks, cost-per-click, and conversions in one account view. Organic search gives you none of that. There is no spend line, no cost-per-click, and no single account that says “your SEO is working.” Instead, organic performance is read off a small stack of instruments, and the skill is knowing which tool answers which question.
That stack has three parts. Google Search Console tells you what happened in the search results — how often you appeared and how often people clicked. Google Analytics 4 tells you what happened after the click, on your site. And a competitor tool — Ahrefs or Semrush — tells you what is happening outside your own account, where the first two tools cannot see. Two of the three are free; the third is paid. Learn which number comes from which instrument and SEO measurement stops being a guessing game.
This page is the measurement anchor for the whole SEO cluster. It names each metric with Google’s own definitions, maps every KPI to the tool that produces it, and settles the two questions readers actually type: “why don’t my Search Console clicks match my Analytics sessions?” and “what is a good average position?” It also corrects the single biggest measurement trap on the platform — running 2026 reporting on a Universal Analytics property that stopped collecting data years ago. MB Adv Agency runs the paid campaigns that complement organic SEO, and builds the analytics setups that measure both, so this guide is written the way we set reporting up for the businesses we work with.
New to the topic? Start with what SEO is for the on-page, off-page, and technical overview this measurement guide reports on. The tools themselves get field-by-field depth in two sibling glossaries — what Google Search Console is and what Google Analytics 4 is. This page’s job is to assemble them into one honest reporting workflow.
Key Takeaways
- SEO has no single dashboard — you read it off three tools. Google Search Console (the search-results layer), Google Analytics 4 (the on-site layer), and Ahrefs or Semrush (the outside-your-account layer). Two of the three are free.
- Search Console gives you four numbers. Clicks, Impressions, CTR, and Average position — Google’s own data about how your site appears in organic results.
- Average position is a trend, not a live rank. It is the average of your topmost position across every impression and query, pooled over localized and personalized results — so a “position 21” corresponds to no single live result.
- All 2026 analytics runs through GA4. Universal Analytics stopped processing data on July 1, 2023. GA4 is event-based: “conversions” are now key events, and “bounce rate” is inverted into engagement rate.
- Clicks and sessions never match — and neither is wrong. Search Console counts a click in the results; GA4 counts an engaged session on the site. They measure different moments. A competitor tool adds keyword gaps, backlink gaps, and share of voice.
Google Search Console: Clicks, Impressions, CTR, and Average Position
Search Console is the search-results layer, it is free, and it reports Google’s own numbers about how your site appears in organic results. Four core metrics anchor its Performance report, and every SEO report starts here.
| Metric | Google’s definition | What it tells you |
|---|---|---|
| Clicks | Counted when a user clicks a link that takes them outside Google Search to your property. | The traffic Google Search actually sent you. |
| Impressions | Counted each time a link to your page appears in a search result for a user. | How often you were shown — your reach and visibility. |
| CTR (click-through rate) | Clicks divided by impressions, expressed as a percentage. | How compelling your result is once shown (title, snippet, and position). |
| Average position | The average of the topmost position of your site across all queries where it appeared (position 1 = top). | A directional trend — not a live per-keyword rank. |
Source: Google Search Console Help — Performance report. Definitions current as of 2026-07-01.
Below those four headline numbers, the Performance report slices your data across six dimensions: Queries (the terms you appeared for), Pages, Countries, Devices, Search Appearance, and Dates. The Queries tab is a live keyword-research feed — the terms you already rank for — and pairs naturally with what keywords are in SEO. For the queries, pages, countries, and devices breakdowns in depth, the sibling glossary covers the Performance report and Search Analytics field by field.
One precise correction, because it dates a lot of content: the Countries tab is reporting — it shows where your clicks and impressions come from — and it is current and useful. Do not confuse it with the old International Targeting report and its country-targeting setting, which Google removed in 2022 (announced August 24, 2022; removed September 22, 2022). You can see your data by country, but you can no longer tell Search Console which country to rank you in. Geographic signals now come from your site’s own structure — hreflang and your ccTLD or subdirectory choices — not from a Search Console setting. If a guide tells you to “set your target country” in Search Console, it predates the removal. Source: Search Console Help.
What “Average Position” Is Actually Worth
Of the four metrics, average position confuses people most — and it is the one that carries this page’s single chart. Here is the correction that matters: average position is not your live rank. It is the average of the topmost position your site held across every impression, pooled over many different queries and over localized, personalized, and device-varied results. A page that ranks #3 for one query and #40 for another does not “rank #21”; the 21 is a blend that corresponds to no single live result. Read it as a trend — is it improving over time? — not as a per-keyword rank checker. For a true per-keyword position, you use a rank tracker in Ahrefs or Semrush.
So why watch position at all? Because the click value collapses steeply from the top of page one, and that collapse is the whole argument. The chart below plots organic click-through rate against ranking position.
Organic Click-Through Rate by Google Ranking Position (First Page Sage, 2026)
The click value falls from 39.8% at position 1 to 1.6% at position 10, and the top three positions take about 68.7% of all clicks (First Page Sage, 2026). That curve is exactly why a two-position average improvement near the top of page one is worth far more than the same move on page two, and why average position — read as a trend — earns its place on the dashboard. Two attribution rules keep this honest: First Page Sage is a meta-analysis estimate, not Google’s own data and not your own Search Console CTR, which you read from your own account; and a competing study from Backlinko reports a different curve with position 1 at 27.6%, so you never combine two studies in one chart. Full source: First Page Sage, 2026.
Google Analytics for SEO: What Happens After the Click
Search Console stops at the click. Google Analytics 4 picks up on your site — the on-site layer that shows what visitors do once they arrive from organic search. Three GA4 numbers carry the SEO story: organic sessions (the Organic Search channel), engaged sessions (the quality signal), and key events (the outcomes you count). Engaged sessions are sessions of 10 or more seconds, or with a key event, or with two or more page views.
Before any of that, the load-bearing correction: Universal Analytics is dead. It stopped processing new data on July 1, 2023 (Universal Analytics 360 followed on October 1, 2023). Any UA property has been frozen for years and collects nothing about today’s organic traffic. All 2026 SEO measurement runs through GA4, which is event-based, not UA’s session-and-pageview model. If a tutorial tells you to open your old UA dashboard or set up a “goal,” it predates the cutover — being confused by it is a documentation-lag problem, not a user error.
| Old Universal Analytics idea | The GA4 term to use now | What it means for SEO |
|---|---|---|
| Universal Analytics property | GA4 property (event-based) | UA is frozen — it collects nothing about today’s traffic. Never report from it. |
| “Organic” medium | Organic Search default channel group | The sessions attributed to organic search — your on-site organic volume. |
| Bounce rate | Engagement rate (its inverse) | Engaged sessions divided by total sessions — the quality signal that replaced bounce rate. |
| Goals / Conversions | Key events | Google renamed “conversions” to key events in the GA4 UI — the outcomes you count. |
| Sessions and pageviews model | Event-based model | Every interaction is an event, so UA-era “goals” and session-first thinking do not translate directly. |
Source: Google Analytics Help. UA stopped processing data July 1, 2023 (Universal Analytics 360: October 1, 2023).
The vocabulary shift is the practical part: report engagement rate, not bounce rate; count key events, not “conversions”; think in events, not sessions-and-pageviews. Depth on the GA4 model lives in the sibling glossary — what Google Analytics 4 is for the event-based model that replaced Universal Analytics, and engagement and user metrics for the engaged-sessions and engagement-rate signals that matter for organic. This page names the correction and routes you there.

Paid search that complements your SEO
Get Your Reporting Stack Telling One Story
Search Console, GA4, and a competitor tool measure your organic performance. MB Adv Agency runs the paid search — Google Ads and PPC — that complements it, and the analytics setups that measure both. The same measurement-first approach that audits organic performance audits spend (see our Google Ads / PPC audit), and a clean stack starts with tracking that survives consent and ad-blockers (see server-side tracking).
Talk to our team →GSC vs GA4: Why Clicks and Sessions Never Match
This is the reconciliation readers keep asking about: open Search Console and Analytics for the same week and the numbers disagree. That is expected, not a bug — the two tools measure different moments.
Search Console counts a click in the search results — the instant a user clicks a link out of Google Search, before the browser finishes loading your page or a consent banner is answered. GA4 counts an engaged session on your site — after the page loads, and subject to cookie and consent settings, ad-blockers, cross-channel de-duplication, and time-zone boundaries. Because a click has to survive all of that to become a measured session, Search Console clicks typically run higher than GA4 organic sessions for the same window. The gap is structural, and neither number is wrong.
The correct posture, and the one the MB Adv Agency team uses in every client report: use Search Console for “what happened in search” and GA4 for “what happened on the site.” There is no single reconciling number that ties them out, so stop hunting for one. What you can control is the quality of the GA4 layer: clean measurement starts with clean tagging, so the events GA4 reports are collected correctly in the first place. For how that collection works, see the data layer and enhanced measurement, and for the on-site quality signals, engagement and user metrics.
Competitor Analysis: Keyword Gaps, Backlink Gaps, and Share of Voice
The third instrument reads what is happening outside your own account — the ground Search Console and GA4 cannot see, because both only report your own property. The standard named pair is Ahrefs and Semrush, and the work comes down to three comparisons.
| Comparison | What it surfaces | Your action |
|---|---|---|
| Keyword gap | Terms your competitors rank for that you do not. | Your content backlog — the next pages to write. |
| Backlink gap (link intersect) | Referring domains linking to them but not to you. | Your outreach and digital-PR list. |
| Share of voice / visibility | Your slice of total clicks across a tracked keyword set versus theirs. | A single trendable “are we winning?” number. |
Source: Ahrefs (Keyword Gap, Link Intersect) and Semrush (Keyword Gap, Backlink Gap). Third-party estimates, not Google figures.
“Competitor analysis” carries 8,800 US searches a month (35,000 global, Keyword Difficulty 47) per Ahrefs — the highest-demand term in this cluster, and the reason it earns its own section. One caveat governs all three comparisons: these tools return third-party estimates, not Google figures, so you use them for direction and prioritization, not as absolute truth. A backlink gap is only actionable once you know what a good link is — see what link building is in SEO.
What a Good SEO KPI Dashboard Tracks
Put the three instruments together and you have a report a CMO can read. The rule is one KPI, one primary tool — do not ask GA4 for impressions or Search Console for on-site engagement. The map below is the blueprint.
| SEO KPI | Primary tool | Notes |
|---|---|---|
| Impressions, Clicks, CTR, Average position | Google Search Console (free) | The search-results layer — Google’s own numbers. |
| Queries / pages / countries / devices breakdown | Google Search Console (free) | Performance-report dimensions (country = reporting only; targeting removed 2022). |
| Organic sessions, engaged sessions, key events | Google Analytics 4 (free) | The on-site layer, event-based (UA ended July 1, 2023). |
| Engagement rate, landing-page key events from organic | Google Analytics 4 (free) | “Key events” replaced “conversions” in the GA4 UI. |
| Keyword gap, backlink gap, share of voice | Ahrefs / Semrush (paid) | The outside-your-account layer — third-party estimates. |
| Rank tracking for a fixed keyword set | Ahrefs / Semrush (paid) | Complements GSC’s averaged position with per-keyword tracking. |
Sources: Google Search Console Help; Google Analytics Help; Ahrefs and Semrush product docs.
Two reading habits keep the dashboard honest. A falling CTR at a steady average position usually means AI Overviews and zero-click results, not a ranking loss — see how AI is changing SEO for why impressions can rise while clicks do not. And a sudden clicks-or-impressions swing across the whole site is often an algorithm update, not your own doing — read understanding Google algorithm updates against your Performance-report dates. To make the report repeatable, automate the pull: the Search Console API feeds a scheduled dashboard (covered in the Performance report and Search Analytics), and durable on-site numbers depend on measurement that survives browser limits. That is where the reporting stack finally tells one story.
Frequently Asked Questions: Tracking SEO Performance
The paid side of the funnel
Turn Organic Visibility Into Leads
You have the reporting stack. The same measurement discipline applies to spend: our Google Ads / PPC audit takes the measurement-first approach to paid, and for the analyst and SaaS teams who live in these dashboards, SaaS PPC services pair organic measurement with paid demand capture.
Explore PPC services →Methodology & Sources
This pillar is the measurement anchor for the SEO cluster; field-level depth on each tool lives in the linked sibling glossaries. Google’s definitions of Clicks, Impressions, CTR, and Average position are from Search Console Help (support.google.com/webmasters/answer/7042828). The Universal Analytics sunset — new data stopped July 1, 2023, and Universal Analytics 360 on October 1, 2023 — and the GA4 vocabulary (key events, engaged sessions, engagement rate) are from Google Analytics Help (support.google.com/analytics/answer/13467533). The removal of the International Targeting report and country-targeting setting in 2022 is from Search Console Help (support.google.com/webmasters/answer/12474899). The organic CTR-by-position figures are a First Page Sage 2026 estimate (updated December 23, 2025), a meta-analysis and not Google data or your own Search Console CTR; Backlinko’s competing curve (position 1 at 27.6%) is named as a separate study and deliberately not combined with it. The competitor-analysis tooling and the “competitor analysis” search demand (8,800 US per month, Keyword Difficulty 47) are from Ahrefs, with Semrush as the second named tool. No mbadv client metrics appear in this article; MB Adv Agency perspective is qualitative, and mbadv runs the paid search that complements organic SEO rather than an SEO service. Reviewed by MB Adv Agency, July 2026.
Understanding your website's SEO performance is crucial for its success in attracting organic traffic. One of the most valuable tools for this purpose is Google Search Console (GSC). This tool provides insights into how your site is performing in Google search results, allowing you to optimize your content and strategies effectively.
How to Track SEO Performance with Google Search Console
Tracking your SEO performance using Google Search Console involves several steps, each offering unique insights into different aspects of your website’s visibility and performance in search engines. The first step is to verify your website with GSC, which allows Google to assess your site's data and provide relevant analytics.

Once you are verified, you can start monitoring metrics such as clicks, impressions, click-through rates (CTR), and the average position of your website's pages in search results. This data helps in understanding the strengths and weaknesses of your SEO strategies. Additionally, Google Search Console provides information on the queries that lead users to your site, helping you identify which keywords are performing well and which may need further optimization.
Setting Up Google Search Console
To begin tracking your SEO performance, follow these simple steps to set up Google Search Console:
- Create a Google Account: If you haven't done so, create a Google account which will give you access to Google Search Console.
- Add Your Website: Enter your website URL in the GSC dashboard to start the verification process.
- Verify Ownership: Choose one of the several verification methods provided, such as uploading an HTML file, adding a meta tag, or utilizing your domain host.
- Set Up a Property: After verification, set up a property for your website to start collecting data.
Once your property is set up, it’s crucial to familiarize yourself with the various features that Google Search Console offers. The Performance report is particularly valuable, as it allows you to analyze how your site is performing in search results over time. You can filter this data by date ranges, countries, devices, and more, providing a comprehensive view of your audience's behavior and preferences. Furthermore, the Coverage report can help you identify any indexing issues that may prevent your pages from appearing in search results, ensuring that your content is accessible to users and search engines alike.
In addition to these reports, Google Search Console also offers insights into mobile usability, which is increasingly important in today’s mobile-first world. By checking the Mobile Usability report, you can identify any issues that may hinder the user experience on mobile devices, such as viewport settings or touch element spacing. Addressing these issues not only improves user engagement but can also positively impact your rankings, as search engines prioritize mobile-friendly sites in their algorithms.
Overview of GSC Features
Google Search Console is packed with features designed to help webmasters and SEO professionals understand and improve their website's search performance. It doesn't just report on performance; it also offers tools and insights that can drive growth. The platform serves as a bridge between Google and website owners, providing essential data that can inform decisions and strategies to enhance visibility and user engagement.

Some of the main features include:
- Performance Report: Offers insights into clicks, impressions, CTR, and positions for your queries.
- Coverage Report: Shows which pages are indexed or having issues, providing an overview of your site’s health.
- Sitemaps: Allows you to submit a sitemap to help Google understand your site structure.
- Mobile Usability: Checks your site’s mobile-friendliness, a crucial factor for SEO in today’s mobile-first world.
- Manual Actions & Security Issues: Alerts you if there are any penalties or security problems affecting your site.
Utilizing Features Effectively
Getting the most out of GSC's features requires a strategic approach. Regularly reviewing the performance report is essential; keep track of your top-performing queries and pages. By comparing data over time, you can identify trends and adjust your content strategy accordingly. For instance, if you notice a drop in clicks for a particular keyword, it may be time to refresh the content or optimize it further to regain lost traffic.
In addition, make use of the Coverage report to quickly resolve indexing issues. If pages are not appearing in search results, investigate the issues highlighted in this section. You may find that your robots.txt file is blocking crawling, or that there are server errors preventing indexing. Moreover, understanding the implications of each error type can help you prioritize fixes; for example, 404 errors can significantly impact user experience and should be addressed promptly. Additionally, leveraging the Sitemaps feature can enhance your site's crawl efficiency, ensuring that Google is aware of all relevant pages, particularly new or updated content.
Another important aspect of GSC is the Mobile Usability report, which not only highlights issues but also provides suggestions for improvement. In an era where mobile traffic often surpasses desktop, ensuring that your site is optimized for mobile users is non-negotiable. This can involve checking for touch element spacing, viewport settings, and ensuring that text is readable without zooming. By addressing these factors, you can significantly enhance user experience and potentially improve your rankings in mobile search results.
Key Reports for SEO
Google Search Console provides several key reports that are particularly useful for SEO analysis. Understanding these reports is vital for improving your site's performance.
Performance Report
The Performance report is perhaps the most critical feature of GSC. It provides detailed insights on how your website is performing in search results. You can filter this information by queries, pages, countries, devices, and dates, allowing for a comprehensive analysis of where your traffic is coming from.
This report enables you to pinpoint high-performing keywords and pages or discover pages that have potential but may not be getting enough visibility. By optimizing these pages based on their data, you can increase organic traffic significantly.
Moreover, the Performance report also allows you to analyze click-through rates (CTR) for different queries. A low CTR might indicate that your meta titles or descriptions need to be more compelling. By tweaking these elements, you can potentially improve your rankings and attract more visitors. Additionally, tracking changes over time can help you understand the impact of your SEO efforts and refine your strategies accordingly.
Coverage Report
The Coverage report shows how well Google is able to crawl and index your website. It identifies issues such as pages with errors, warnings, and if your pages are excluded from indexing.
Addressing the problems highlighted in this report can enhance your organic search visibility. Fixing crawl errors and ensuring that important pages are indexed can lead to better rankings in search results.
In addition to identifying errors, the Coverage report also provides insights into the overall health of your site. It categorizes issues into different types, such as "Submitted and indexed," "Errors," and "Excluded," allowing you to prioritize your fixes effectively. Regularly monitoring this report can help you stay ahead of potential issues that could hinder your site's performance, ensuring that your content remains accessible to both users and search engines alike. Furthermore, understanding the reasons behind exclusions can lead to better content strategies, ensuring that your most valuable pages are not inadvertently left out of search results.
How to Analyze Performance Data
Once you have gathered enough data from Google Search Console, the next step is to analyze it effectively. Here are some practical strategies to consider:
Track Changes Over Time
One of the most substantial benefits of GSC is that it allows you to track your site's performance over time. Examine your performance and coverage reports at regular intervals, ideally monthly or quarterly. This practice highlights the impact of any SEO changes or content updates you have implemented. By maintaining a historical record of your performance metrics, you can discern patterns and trends that may not be immediately apparent. For example, a sudden spike in traffic could correlate with a specific marketing campaign or a seasonal trend, providing insights for future strategies.
Identify Opportunities
Use the data to identify performance gaps. For instance, if certain keywords are bringing you impressions but low clicks, consider optimizing those pages for better engagement. Additionally, target related long-tail keywords to capture more traffic. This approach not only enhances the visibility of your content but also aligns it more closely with user intent. Delve into the search queries report to uncover questions or phrases that users are searching for, which can inform your content creation and optimization strategies.
Benchmark Against Competitors
An advantageous practice is benchmarking your performance against competitors. Analyze your position for key terms compared to your competitors and strategize accordingly. If they are outranking you for specific keywords, there may be an opportunity to create more valuable or relevant content on those topics. Furthermore, understanding their backlink profiles can provide insights into potential link-building opportunities for your own site. Tools like Ahrefs or SEMrush can complement GSC by offering a more comprehensive view of your competitive landscape.
By utilizing Google Search Console optimally, you will not only be tracking your SEO performance but also laying down a solid framework for ongoing improvements. Frequent monitoring and strategic adjustments based on the insights gleaned will help propel your website to higher search rankings and increased organic traffic. Additionally, consider setting up alerts for significant changes in your performance metrics, such as sudden drops in traffic or indexing issues. This proactive approach allows you to address potential problems before they escalate, ensuring your website remains healthy and competitive in search results.

As a Google Ads expert, I bring proven expertise in optimizing advertising campaigns to maximize ROI.
I specialize in sharing advanced strategies and targeted tips to refine Google Ads campaign management.
Committed to staying ahead of the latest trends and algorithms, I ensure that my clients receive cutting-edge solutions.
My passion for digital marketing and my ability to interpret data for strategic insights enable me to offer high-level consulting that aims to exceed expectations.
Google Partner Agency
We're a certified Google Partner Agency, which means we don’t guess — we optimize withGoogle’s full toolkit and insider support.
Your campaigns get pro-level execution, backed by real expertise (not theory).
4.9 out of 5 from 670+ reviews on Fiverr.
That’s not luck, that’s performance.
Highly recommend Matteo to set up your server side tracking. He has a deep understanding of e-commerce tracking and will go above and beyond to make sure everything is set up correctly and working 100%. If you are scaling your store this set up is non-negotiable in my opinion and there isn't many people who have this much knowledge or put the effort in to get it right. Thanks again!
avorodesign.com
I can only recommend Matteo! He was very patient, professional and very knowledgeable about GA4, Consent Mode v2, and GDPR compliance. Communication was clear, and the setup was done professionally and efficiently. Highly recommend him for anyone needing reliable tracking implementation.

www.natureiki.life
Matteo shines in the realm of online professionals. His work is not only deep in data but also complemented by his proactive communication and cooperation, setting a new standard for freelancers. If you want someone who truly exceeds expectations, look no further. Highly recommended!

www.omanbeverlysmyth.com
Exceptional Service Beyond Expectations - Outstanding Service Impeccable depth, flawless delivery, and exceptional language fluency—this service exceeded all expectations. Highly recommended. Matteo truly ROCKS!!!

ium-paris.com
Top-notch, always highly value working with Matteo. An absolute Google Ads Genius. This is approximately the 8th time I have hired him and he's helped us get 6-7 ROAS. We are excited in continuing to improve our lead flow. Hire this guy if you need Google Ads help. Thanks Matteo!
www.dleeventgroup.com
I finally found the guy who can setup server side tracking and all the ecosystem properly. I definitely recommend Matteo. He is very responsive, kind and wants to dig into things. He configured GA4, Meta, Google Ads, Outbrain and google consent v2 with Cookiebot. Thanks Matteo.
inomega.fr
MB Adv delivered exceptional work with outstanding professionalism and lots of patience, taking time to see effects of changes made and not just do the work and submit it. The proactive communication and video summaries of the work completed made working with Matteo a pleasure, as he consistently went above and beyond. Highly recommended for web analytics projects! We are already working on another project.

www.withnellsensors.co.uk
Working with Matteo on my Google Ads was a game-changer. He's not just a strategist, he's a true partner. He understood my goals and tailored a campaign that perfectly reached my target audience. I'm grateful for his expertise and dedication.
dccargo.com
Click-driven mind
with plastic-brick obsession.
We build Google Ads campaigns with the same mindset we use to build tiny brick worlds: strategy, patience, and zero tolerance for wasted pieces.
Data is our blueprint. Growth is the only acceptable outcome.