Meta Ads Metrics, Benchmarks & Reporting (2025)
Meta Ads Learning Phase Threshold
50
optimization events per ad set per week — the structural exit condition for the learning phase. Below this, delivery is unstable and cost per result is unreliable.
2.59%
US median CTR — leads campaigns (WordStream 2025)
$27.66
US median CPL — leads campaigns (WordStream 2025, n=726)
3
ad relevance diagnostics replaced the single relevance score (retired April 2019)
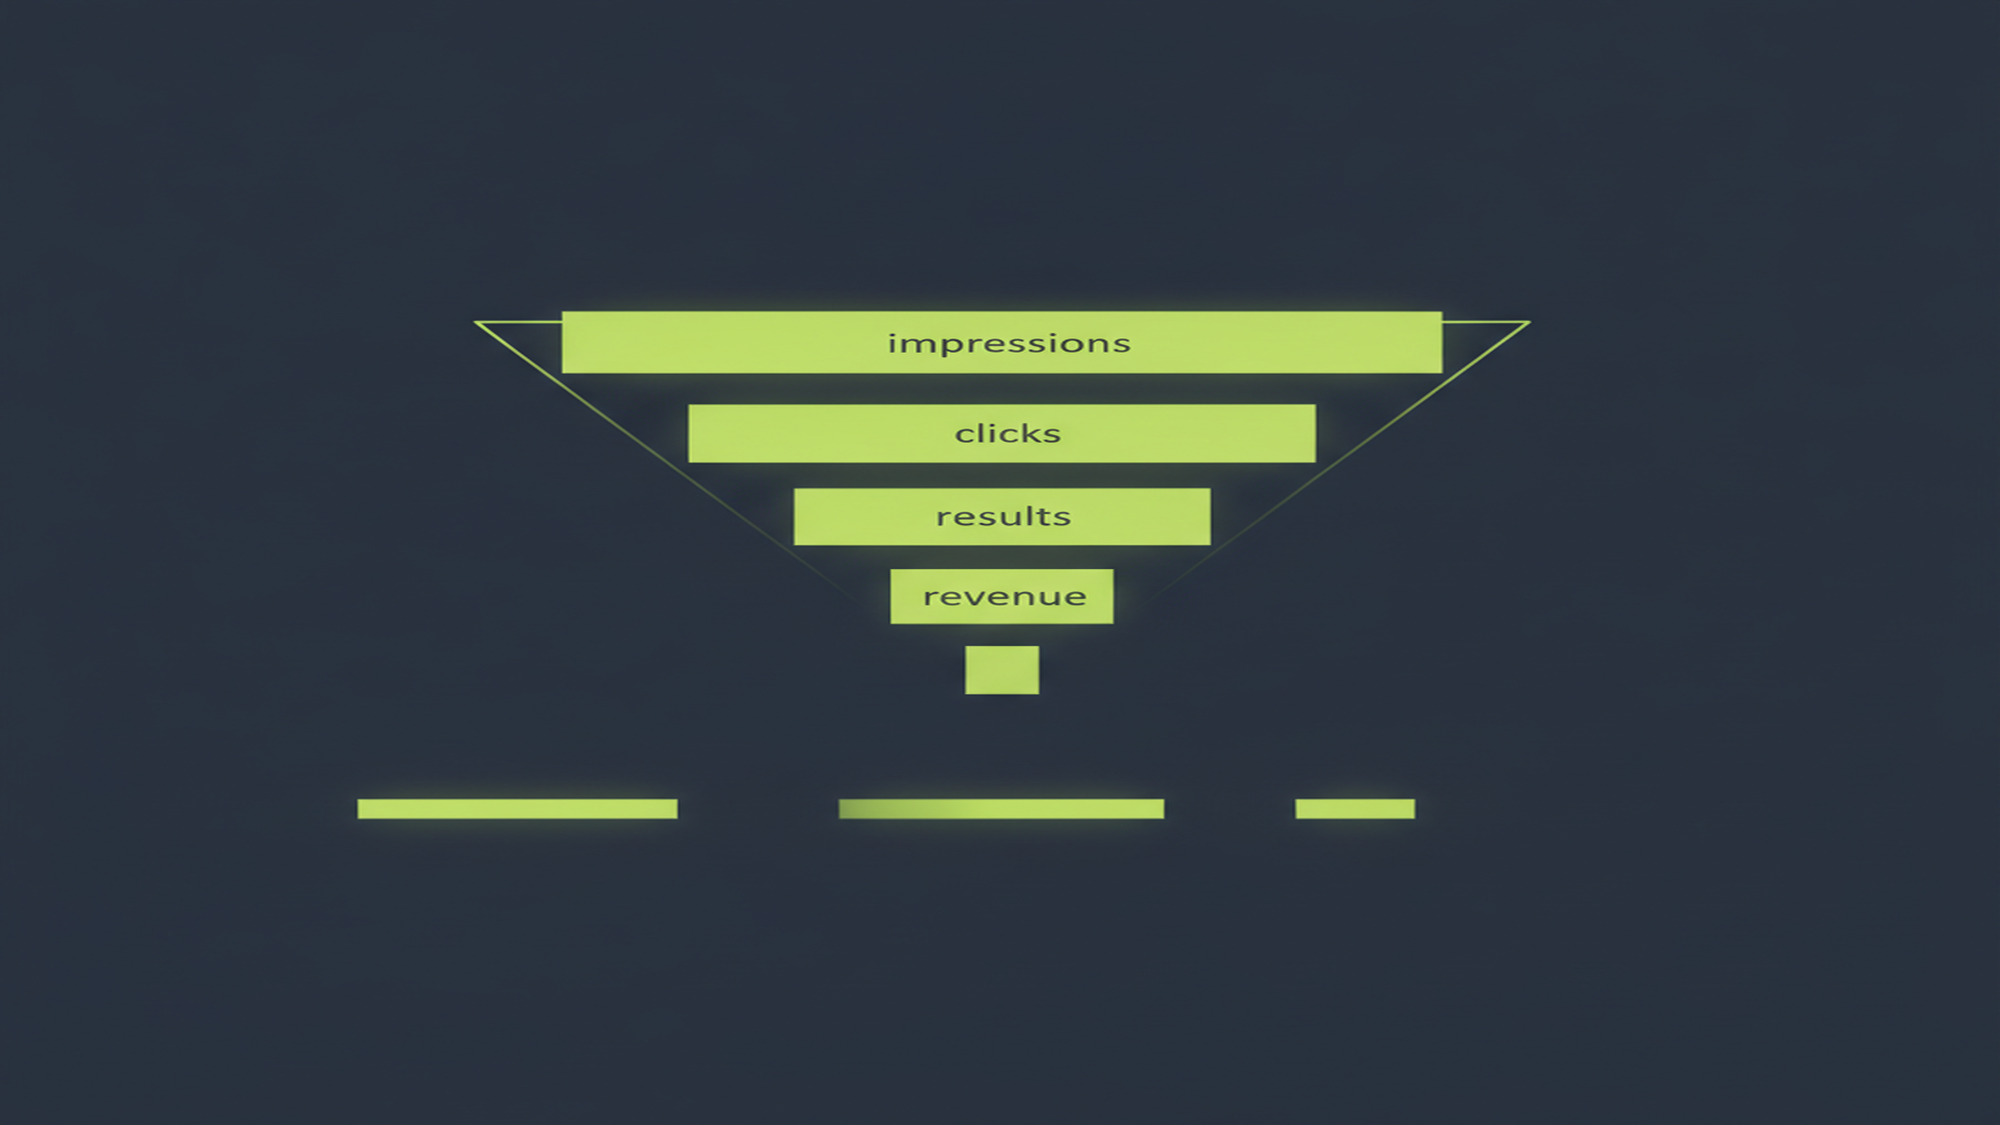
The Meta Ads Metrics Funnel: From CPM to ROAS
Meta ads metrics form a delivery funnel, not a flat scorecard. Spend buys impressions (CPM), impressions earn clicks (CTR → CPC), clicks earn results (conversion rate → cost per result), and results earn revenue (ROAS). Each layer depends on the one above it — which means a bad CPC is usually a CPM and CTR problem, and a bad cost per result is usually a conversion rate problem. Diagnosing the right layer before making changes is the core skill this pillar covers.
Meta measures this funnel with two types of signals: outcome metrics (the numbers that show what happened) and diagnostic metrics (the signals that explain why). The outcome metrics are CPM, CTR, CPC, conversion rate, cost per result, and ROAS. The diagnostic layer is Meta's three ad relevance diagnostics — quality ranking, engagement rate ranking, and conversion rate ranking — which appear at the ad level once an ad clears 500 impressions. Reading the diagnostics alongside the outcome metrics is the fastest path to the right optimization lever.
Frequency sits at the intersection of both layers: it is both an outcome (impressions ÷ reach tells you how saturated the audience is) and a diagnostic (when frequency climbs above 3.5 on a cold audience, CTR decline and CPM pressure follow). The learning phase — Meta's delivery stabilization period — adds a structural layer beneath the funnel: ad sets in learning produce unreliable cost per result, regardless of how well the funnel metrics look.
The diagnostic order: check learning phase status first, then read the three relevance rankings, then check frequency, then review the conversion funnel. Most optimization mistakes come from jumping to a bid change before completing this sequence.
| Metric | Formula | What it measures | Primary use |
|---|---|---|---|
| CPM | Spend ÷ Impressions × 1,000 | Auction price per 1,000 impressions | Delivery cost / pacing |
| Reach | Unique people who saw the ad | Audience breadth | Saturation check |
| Frequency | Impressions ÷ Reach | Average exposures per unique person | Ad fatigue early warning |
| CTR | Clicks ÷ Impressions × 100 | Creative–audience relevance signal | Top-of-funnel diagnostic |
| CPC | Spend ÷ Clicks | Cost per click | Budget pacing |
| Conversion Rate | Results ÷ Clicks × 100 | Landing page + offer effectiveness | Mid-funnel health |
| Cost Per Result | Spend ÷ Results | Cost per optimization event | Lead-gen primary KPI |
| ROAS | Revenue ÷ Spend | Revenue efficiency | E-commerce primary KPI |
Sources: Trafius (CPM formula); Meta Business Help (relevance diagnostics); formula reference per HarMukh Technologies Meta Ads Metrics List.
The formulas above are stable — Meta has not changed these definitions. What changes is context: CPM without a frequency read is incomplete; CTR without a conversion rate read is misleading. The sections below work through each layer of the funnel in diagnostic order. For how the auction prices CPM itself, see Meta ads cost, budgeting & bidding. For how Pixel and CAPI events populate conversion rate and cost per result, see Meta Pixel & conversion tracking.
Ad Relevance Diagnostics: The Three Rankings That Replaced the Relevance Score
Meta retired the single 1–10 relevance score in April 2019 and replaced it with three independent diagnostics: quality ranking, engagement rate ranking, and conversion rate ranking. Each rates an ad as Above Average, Average, or Below Average relative to other ads competing for the same audience. They are not auction inputs — they are post-delivery diagnostic tools that appear once an ad accumulates at least 500 impressions.
The three diagnostics isolate different failure layers. Quality ranking reflects perceived ad quality: user feedback signals including ad hiding, reports, sensationalized language, and engagement bait. A Below Average quality ranking means the audience is actively downgrading the ad through its behavior — the problem is creative trust, not reach. Engagement rate ranking reflects expected engagement (likes, comments, shares, saves) versus competing ads for the same audience — a pure creative resonance signal. Conversion rate ranking reflects expected conversion rate versus other ads optimizing for the same goal in the same audience — and a Below Average here almost always points to the landing page or offer, not the ad itself.
Reading the three rankings together lets a practitioner isolate the failure layer without guessing. Below Average quality + Below Average engagement identifies a creative problem: the ad is not landing with the audience. Above Average quality + Above Average engagement + Below Average conversion identifies a landing-page or offer problem: the creative is working but the destination is breaking down. Any pattern involving Below Average quality alone indicates perceived trust issues — clickbait signals, sensational copy, or engagement bait — and the fix is creative, not budget. For a detailed lever map, see the diagnostic decision tree in the next section.
| Diagnostic | What it measures | Scale | Failure signal |
|---|---|---|---|
| Quality ranking | Perceived ad quality vs. competing ads for the same audience — includes ad hiding, negative feedback, sensationalized copy, engagement bait | Above / Average / Below Average | Creative trust problem; refresh tone and claims |
| Engagement rate ranking | Expected engagement rate (likes, comments, shares, saves) vs. competing ads for the same audience | Above / Average / Below Average | Creative resonance problem; refresh hook and format |
| Conversion rate ranking | Expected conversion rate vs. ads with the same optimization goal targeting the same audience | Above / Average / Below Average | Landing page or offer problem; fix message match |
Source: Meta Business Help — About Ad Relevance Diagnostics; Meta Business Help — About Quality Ranking. Diagnostics require ≥500 impressions and are not inputs into the Meta ad auction.
Two facts about the diagnostics that most published guides get wrong: first, they are not auction inputs. Meta's delivery system does not use these ratings to price or prioritize impressions in the auction. Their role is diagnostic — they are feedback signals generated after delivery, not bidding components. Second, they do not display until 500 impressions accumulate on the specific ad. New ads always show empty diagnostics, and low-spend ads stay empty for days. Waiting for the diagnostics to populate before drawing conclusions is not optional — it is the only valid read. For context on the audit-level diagnosis these ratings feed into, Meta ads formats & creative covers the creative variables that move each ranking.
How to Read All Three Rankings Together
Each ranking is a relative rating against ads competing for the same audience. Read in combination, the three rankings isolate which layer of the delivery system is underperforming — creative quality, creative resonance, or post-click conversion. The table below maps the six most common ranking combinations to a diagnosis and the lever to pull first.
| Quality ranking | Engagement ranking | Conversion ranking | Diagnosis | First lever |
|---|---|---|---|---|
| Above Avg | Above Avg | Above Avg | Well-optimized; stable delivery | Scale budget gradually; monitor frequency |
| Below Avg | Below Avg | Any | Creative problem — ad is not landing | Refresh hook, remove engagement bait, new format |
| Above Avg | Above Avg | Below Avg | Landing-page or offer problem | Fix message match; improve page speed; revisit offer |
| Above Avg | Below Avg | Above Avg | Curiosity-click creative, low resonance | Strengthen engagement signal (video, social proof) |
| Below Avg | Any | Any | Low perceived quality — clickbait or sensational | Remove engagement bait; cleaner claims and copy |
| Below Avg | Below Avg | Below Avg | Targeting–creative mismatch | Rebuild audience and creative together from scratch |
Source: Meta Business Help — Ad Relevance Diagnostics; AdStellar, Meta Ads Performance Metrics Explained 2026. Rankings are relative to competing ads for the same audience; no pattern is a verdict on absolute creative quality.
The targeting–creative mismatch pattern (all three Below Average) is the most expensive failure mode in Meta advertising: the algorithm is spending budget on impressions that generate no useful signal. In this case, pausing and rebuilding is faster than iterating. MB Adv Agency has found that targeting–creative mismatches most often occur when an ad originally built for a warm retargeting audience runs against a broad cold prospecting audience without being redesigned — the creative assumes purchase intent that the cold audience does not have. For creative diagnostic guidance by format, see Meta ads formats & creative. For accounts in legal PPC or dental PPC, where cost per lead is structurally high, a Below Average conversion rate ranking almost always points to the intake form or landing page — the ad is working, the destination is not.
Facebook Ads Benchmarks by Industry — 2025 Data
The most comprehensive US Facebook benchmark dataset is the WordStream / LocaliQ Facebook Ads Benchmarks 2025 report: 726 US leads campaigns + 554 US traffic campaigns, April 1, 2024–June 30, 2025, all figures are medians. The report publishes CTR, CPC, conversion rate, and CPL for leads campaigns — it does not publish CPM by industry or ROAS by industry (confirmed by direct fetch; see the data gaps section below).
| Industry | Avg CTR | Avg CPC | Avg CVR | Avg CPL |
|---|---|---|---|---|
| Arts & Entertainment | 3.92% | $1.08 | 9.34% | $18.17 |
| Attorneys & Legal Services | 2.11% | $4.10 | 10.53% | $18.17 |
| Beauty & Personal Care | 2.55% | $3.06 | 5.29% | $51.42 |
| Career & Employment | 2.81% | $0.86 | 5.77% | $17.64 |
| Dentists & Dental Services | 1.05% | $9.78 | 6.38% | $76.71 |
| Education & Instruction | 1.86% | $1.65 | 10.08% | $28.22 |
| Furniture | 1.48% | $2.18 | 3.77% | $40.04 |
| Health & Fitness | 1.72% | $2.64 | 5.63% | $52.98 |
| Home & Home Improvement | 1.94% | $2.23 | 5.22% | $41.26 |
| Personal Services | 1.99% | $2.08 | 6.51% | $30.57 |
| Physicians & Surgeons | 3.02% | $2.23 | 4.51% | $47.47 |
| Real Estate | 3.75% | $1.57 | 9.53% | $16.61 |
| Restaurants & Food | 2.97% | $0.74 | 18.25% | $3.16 |
| Sports & Recreation | 3.41% | $1.07 | 5.48% | $19.30 |
| Overall average (Leads) | 2.59% | $1.92 | 7.72% | $27.66 |
| Overall average (Traffic) | 1.71% | $0.70 | — | — |
Source: WordStream / LocaliQ, Facebook Ads Benchmarks 2025 (726 US leads campaigns + 554 US traffic campaigns; April 1, 2024–June 30, 2025; median values). Traffic-objective CVR and CPL not published in the 2025 report (— cells reflect absent data, not zero). Green = top-quartile; red = highest cost. Cross-reference: LocaliQ 2025 Facebook benchmarks.
Two patterns in the data that practitioners consistently misread: first, Dentists carry a 1.05% CTR and a $76.71 CPL — not because the ads are failing, but because the audience is small and competition is structurally high. The low CTR is correct for the vertical; the right benchmark question is whether the CPL sits inside the practice's patient lifetime value. Second, Restaurants & Food produce an 18.25% conversion rate and a $3.16 CPL — the highest CVR and lowest CPL in the dataset — but those are local awareness campaigns with low conversion barriers. A dental or legal advertiser comparing their CPL to $3.16 is benchmarking against a different product. For vertical-specific lead cost context, see real estate PPC services and supplements & nutrition PPC for e-commerce, and HVAC PPC in Flagstaff and legal PPC in Missoula for city-level lead cost context.
Ad Fatigue and Frequency: The Early Warning Gauge
Frequency — impressions divided by reach — measures how many times the average unique person in your reached audience has seen your ad. It is the leading indicator of ad fatigue: frequency climbs before CTR drops, CTR drops before cost per result rises, and by the time cost per result looks bad in the weekly report, the fatigue has been building for two to three weeks. Monitoring 7-day frequency and CTR delta together is the only way to intervene before CPL deteriorates.
Cold prospecting audiences fatigue at lower frequency thresholds than warm retargeting audiences. The asymmetry exists because retargeting audiences already know the brand — repeat exposure reinforces consideration rather than producing irritation. The thresholds below are practitioner consensus ranges from AdAmigo's Meta Ads Frequency Benchmarks study, not Meta-published official figures. Meta's own Ads Manager provides a creative fatigue alert at the ad level — the platform-level signal and the frequency thresholds below are complementary, not redundant. See Meta Business Help on creative fatigue recommendations.
| Audience type | Optimal range | Warning threshold | Critical threshold |
|---|---|---|---|
| Cold prospecting (new audiences) | Below 3.0 | 3.0 | 3.5+ |
| Warm retargeting (engaged / website visitors) | 4.0–6.0 | 6.0 | 7.0+ |
Source: AdAmigo, Meta Ads Frequency Benchmarks (When Ads Start Fatiguing). Practitioner consensus ranges, not Meta-published official thresholds.
| Signal | Threshold | Observed impact | Severity |
|---|---|---|---|
| CTR drop (7-day window) | 10% decline | Early fatigue signal — monitor closely | Early |
| CTR drop (14-day window) | 20% decline | Serious fatigue — refresh creative immediately | Serious |
| CPA increase (7-day window) | 15% rise | Cost efficiency breaking down — intervene | Serious |
| Frequency ≥5 exposures | Frequency 5+ | Costs rise 50–80%; CTR drops 40–55% | Critical |
| Frequency 7–10 | Frequency 7–10 | CTR declines 60–75% | Critical |
| Frequency 9 (CPC spike) | Frequency 9 | CPC spikes ~161% vs. baseline | Critical |
Source: AdAmigo, Meta Ads Frequency Benchmarks. CTR decline precedes CPA deterioration; use CTR delta as the primary monitoring metric, not lifetime impressions.
The correct reporting cadence for frequency-sensitive accounts watches 7-day frequency alongside 7-day CTR delta — not lifetime impressions, which accumulate regardless of saturation. A prospecting campaign with 2 million lifetime impressions and a frequency of 2.8 is in a healthier state than one with 400,000 impressions and a frequency of 4.1. The seasonality section below covers how to use planned demand cycles as the creative-refresh calendar — a systematic approach to preventing fatigue before it accumulates rather than reacting after the CTR has already dropped. For campaigns targeting service industries with small geographic audiences, plumbing PPC in Missoula and roofing PPC in Flagstaff illustrate how small local audiences hit fatigue thresholds faster than metro-scale campaigns.
The Meta Ads Learning Phase: A Volume Problem, Not an Algorithm Problem
An ad set needs 50 optimization events per rolling 7-day window to exit the learning phase. During learning, Meta's algorithm is in exploration mode — testing placements, timings, and audience sub-segments without a stable reference. Delivery is unstable, CPAs fluctuate significantly, and the cost-per-result numbers in the reporting dashboard do not reflect long-run account efficiency. The 50-event threshold is structural: it is a volume math problem, not a patience problem.
The event count is per ad set, not per individual ad. Five creatives inside one ad set share a single 50-event pool — the account needs 50 events total across all ads in that set, not 50 per creative. Optimization events include Pixel browser events, Conversions API server-side events, and Meta-modeled (inferred) conversions. An ad set re-enters learning if it falls below 50 events in any rolling 7-day period after having previously exited — a budget cut, a significant edit, or a creative refresh all trigger re-entry. Sources: AdLibrary, Meta Ads Learning Phase Guide; CampaignPros, Facebook Learning Phase Explained.
The minimum weekly budget to exit learning = Target Cost Per Result × 50. At a $30 CPA target, the floor is $1,500 per week. An account spending below this threshold will remain in Learning Limited indefinitely under that cost cap.
| Target Cost Per Result | Min. weekly budget (50 events × CPA) | Min. monthly budget equivalent |
|---|---|---|
| $5 per result | $250/week | ~$1,083/mo |
| $10 per result | $500/week | ~$2,167/mo |
| $20 per result | $1,000/week | ~$4,333/mo |
| $30 per result | $1,500/week | ~$6,500/mo |
| $50 per result | $2,500/week | ~$10,833/mo |
| $75 per result | $3,750/week | ~$16,250/mo |
Formula: 50 events × target CPA. Derived from the 50-event/week threshold per AdLibrary and CampaignPros. Monthly equivalent = weekly × (365/7/12). Dental and legal verticals with $50–$76 CPLs require disproportionate weekly budgets to exit learning.
"Learning Limited" is the status Meta assigns when an ad set structurally cannot reach 50 events per week under its current configuration. The three most common causes: budget too low relative to the target CPA (the table above quantifies this); audience too narrow to generate sufficient delivery volume; or too many ad sets splitting a low total conversion volume. MB Adv Agency has found that accounts stuck in persistent "Learning Limited" across multiple ad sets almost always share the same root cause: too many ad sets competing for the same conversion pool. Consolidating from eight ad sets to three — concentrating the same weekly conversion volume into fewer pools — exits learning faster than any bid adjustment. This is a structural fix, not a creative one. For dental accounts where CPL runs near $76, see dental PPC services for how minimum budget requirements scale with vertical CPL. For PPC management in Austin and PPC management in Chicago, learning phase budget math is a standard part of Meta account onboarding.
US Search Demand: Meta Ads Metrics & Reporting Keywords (June 2026)

Facebook Ads A/B Testing: How Meta's Experiment Tool Works
Meta's A/B test tool — accessed through Ads Manager under Experiments — splits the audience into non-overlapping groups so no person sees both ad variants. Each group sees exactly one version of the variable under test: creative, audience, placement, or optimization goal. This eliminates overlap bias, which makes self-managed A/B tests in separate ad sets unreliable. The tool tests one variable at a time; mixing variables in a single test makes it structurally impossible to isolate which change drove the result.
| Requirement | Meta guidance | Notes |
|---|---|---|
| Confidence threshold (A/B test) | 65% | Meta's platform threshold for declaring a winner in standard A/B tests |
| Confidence threshold (Lift test) | 90% | Holdout tests measuring causal ad impact require higher confidence |
| Minimum test duration | 7 days | Captures day-of-week variation; shorter tests miss weekend vs. weekday patterns |
| Minimum results per variant | ~50 conversions | Below 50 results, statistical signal is insufficient; some practitioners target 100 |
| Variables per test | One only | Creative, audience, placement, or optimization goal — never combined |
| Audience split method | Non-overlapping groups | No person sees both variants; eliminates cross-contamination |
Sources: Meta Business Help — About A/B Testing; Meta Business Help — About Confidence in Your Tests; Benly AI, Meta Ads A/B Testing Guide. Note: some practitioner guides cite a 95% confidence standard — this is a self-imposed standard, not Meta's platform threshold of 65% for A/B tests.
MB Adv Agency uses the 65% confidence threshold as the minimum bar for creative decisions and 90% for audience or strategy changes that affect account structure. The practical implication: a 65% confident result on a creative A/B test is directionally reliable enough to retire the losing variant. A 65% confident result on a bid strategy test is not — structural changes need higher confidence before execution. The A/B tool is most useful for creative decisions at scale; for audience testing, the convergence toward Advantage+ audience in Meta's platform increasingly makes manual audience A/B tests a secondary lever rather than the primary one. For advertisers running fashion PPC or beauty products PPC on Meta, creative A/B testing at the hook level — first three seconds of video or static image composition — produces the most consistently actionable signal.
Average Cost Per Lead by Industry: Facebook Leads Campaigns (2025)

Meta Ads Seasonality: Planning Creative Refreshes Around Demand Cycles
Meta ad costs are not flat across the calendar year. CPM rises during periods of peak advertiser competition — Q4 holiday season, Valentine's Day, Mother's Day, summer for travel and fitness — because more advertisers are bidding for the same impressions. For advertisers who do not adjust creative and frequency cadence ahead of these windows, the result is rising CPM with no corresponding improvement in conversion rate: cost per result climbs while results plateau.
The practical approach is to treat seasonality as the creative-refresh calendar rather than as a budgeting problem. A creative refresh scheduled two to three weeks before a demand peak achieves two things: it resets frequency (a fresh creative resets the audience's exposure counter), and it aligns the message with the audience's buying intent at the moment demand peaks. For HVAC PPC and plumbing PPC advertisers, demand spikes are predictable — summer AC service calls and winter heating emergencies — and a creative refresh cadence tied to those windows is more efficient than reacting to CPM increases after they occur.
| Period | CPM pressure | Verticals most affected | Recommended action |
|---|---|---|---|
| Oct–Dec (Q4 / holiday) | High | E-commerce, fashion, beauty, supplements, gifts | Refresh creative in Sep; raise budget ceiling |
| Jan–Feb (resolutions + Valentine's) | Moderate–High | Fitness, health, e-commerce, real estate | New-year creative angle; frequency reset |
| May–Jun (summer demand, home services) | Moderate | HVAC, landscaping, real estate, travel | Refresh before Memorial Day; lead with urgency |
| Mar–Apr (off-peak) | Low | Most verticals — structural low CPM window | Prospecting push; test new audiences cheaply |
CPM pressure is structural (auction density from increased advertiser competition) and is not published as official Meta data. Q4 CPM elevation is the most consistently documented seasonal pattern across practitioner sources. Source: Search Engine Land, Facebook ad costs jump 21% in 2025.
Meta Ads Learning Phase: Weekly Budget Required to Hit 50 Events

Vanity Metrics vs. Outcome Metrics in Your Meta Report
A Meta ads monthly report that leads with reach, impressions, and total spend is optimized for volume optics, not business decisions. Reach measures how many unique people saw an ad — not whether they were the right people. Impressions measures how many times the ad was shown — not whether it produced any action. These are delivery confirmation numbers, not performance numbers. Outcome metrics — cost per result, ROAS, and conversion rate — are the only metrics that answer whether the spend is working.
| Metric | Category | What it tells you | Report weight |
|---|---|---|---|
| Reach | Delivery | Unique people reached; no quality signal | Context only — use with frequency |
| Impressions | Delivery | Total ad views; accumulates regardless of saturation | Context only — use with frequency |
| CPM | Delivery cost | Auction pricing per 1,000 impressions | Diagnostic — not a business outcome |
| Frequency | Diagnostic | Saturation level; early fatigue signal | Monitor weekly alongside CTR delta |
| CTR | Diagnostic | Creative–audience relevance; not a revenue signal | Monitor trend; benchmark against segment, not overall average |
| Conversion Rate | Outcome | Post-click performance; landing page + offer quality | Primary — track by landing page and audience |
| Cost Per Result | Outcome | True cost of each optimized action (lead, purchase, etc.) | Primary KPI for lead-gen accounts |
| ROAS | Outcome | Revenue per dollar spent; requires purchase event tracking | Primary KPI for e-commerce accounts |
Framework derived from Meta Ads Manager reporting column structure. ROAS requires accurate purchase event data via Meta Pixel or Conversions API; without complete event coverage, the ROAS figure is understated.
The correct reporting structure for a monthly Meta account review: open with cost per result or ROAS (the headline), support with CTR and conversion rate trends (the diagnostic layer), and close with frequency and learning phase status (the structural layer). Impressions and reach belong in a delivery summary footnote — not in the lede. For real estate PPC and supplements & nutrition PPC accounts, where purchase intent and attribution windows differ, the reporting framework needs to specify the attribution window (7-day click, 1-day view) before any cost-per-result figure is meaningful.
CPM and ROAS Benchmarks: What the Published Data Does Not Cover
WordStream's Facebook Ads Benchmarks 2025 report — the most cited US Facebook benchmark dataset — does not publish CPM by industry or ROAS by industry. This is a deliberate scope choice: the WordStream dataset covers Leads and Traffic campaigns, and CPM + ROAS data requires purchase event tracking at a scale and methodology that a Leads/Traffic benchmark study does not provide.
Third-party DTC/e-commerce panels publish CPM and ROAS data, but their methodology differs: Triple Whale's Facebook Ads Benchmarks aggregates data from DTC e-commerce brands and reports a median ROAS near 1.9–2.0 and median US Meta CPMs in the low-to-mid teens, but that panel skews heavily toward e-commerce brands using purchase events — a different advertiser population than the Leads benchmark data above. Presenting Triple Whale's ROAS figure as a cross-industry Meta benchmark overstates what the data actually supports. The correct approach is to benchmark CPM and ROAS within your own vertical and account history, not against a cross-category average. For advertisers in fashion PPC or beauty products PPC, ROAS benchmarks from DTC panels are closer to relevant — for legal PPC or dental PPC, they are structurally inapplicable. CPM on Meta is set by the auction, not by the advertiser — the only lever available is the downstream funnel efficiency that earns cheaper delivery through higher quality and engagement rankings.
Meta Ads Optimization: Diagnostic Order of Operations
Most Meta optimization mistakes stem from applying a fix to the wrong layer. A bid change cannot fix a creative problem. A creative refresh cannot fix a learning phase exit problem. A budget increase cannot fix an audience saturation problem. The diagnostic framework below works through the account in the correct sequence — structural issues first, then auction-layer issues, then creative issues, then landing-page issues.
| Step | Check | What to look for | Fix if failing |
|---|---|---|---|
| 1 | Learning phase status | Is any ad set "Learning" or "Learning Limited"? | Consolidate ad sets; raise budget to hit 50 events/week; avoid edits until stable |
| 2 | Frequency (7-day) | Is 7-day frequency above 3.5 (cold) or 7.0 (warm)? | Refresh creative; expand audience; add exclusions for converted users |
| 3 | Ad relevance diagnostics | Which ranking is Below Average? (≥500 impressions required) | Apply the diagnostic decision tree (Table 3) to identify the layer |
| 4 | CTR trend | Is CTR declining over 7 or 14 days? | Creative refresh (10% drop = early warning; 20% = intervene) |
| 5 | Conversion rate | Is landing page conversion rate declining independent of CTR? | Fix message match between ad and landing page; revisit offer; check page speed |
| 6 | Cost per result vs. target | Is CPA trending above target for more than 7 days? | Identify which layer above is causing it; do not raise budget before diagnosing |
Diagnostic order matters: structural issues (learning phase, frequency) override creative issues. Applying a bid change before completing steps 1–3 adds cost without addressing the root cause. Framework per MB Adv Agency internal optimization protocol and Meta Business Help guidance on ad relevance diagnostics.
MB Adv Agency applies this diagnostic sequence as the standard first-call protocol for underperforming Meta accounts. The most common finding: accounts that have been running bid adjustments or creative refreshes for weeks without improvement are almost always sitting on a learning phase or frequency problem at step 1 or 2 — a structural problem that creative and bid changes cannot resolve. The sequence above prevents that loop. For accounts running across service verticals — HVAC PPC, plumbing PPC, or fitness gym PPC — the frequency threshold is the most commonly skipped diagnostic, because small local audiences reach fatigue at frequency 2.5–3.0 faster than the thresholds above suggest. For campaign budget setup that prevents learning phase problems from the start, see Meta ads cost, budgeting & bidding.
Average Click-Through Rate by Industry: Facebook Leads Campaigns (2025)

Stuck in "Learning Limited" or watching frequency climb past 3.5?
MB Adv Agency diagnoses the structural layer first — learning phase, frequency, and relevance diagnostics — before touching bids or creative. Most accounts need a consolidation fix, not more spend. Fashion, beauty, supplements, and DTC brands benefit most from this framework.
See Fashion PPC Services →Three Common Meta Ads Reporting Misconceptions
These are the three most consequential errors in how practitioners and business owners read Meta ads reports. Each one leads to a different category of bad decision.
1. "The relevance score is low" — that metric does not exist
Meta retired the single 1–10 relevance score in April 2019. The replacement is three independent diagnostics: quality ranking, engagement rate ranking, and conversion rate ranking — each rated Above Average, Average, or Below Average relative to ads competing for the same audience. Any guide, agency report, or training course that tells an advertiser to "raise their relevance score" is describing a metric that has not existed for six years. The correct action is to read the three rankings together and use the diagnostic decision tree to identify which layer is underperforming. Guides that conflate the old relevance score with the current diagnostics produce incorrect optimization advice because the two systems measure different things: the old score was a composite integer; the three diagnostics are independent, layer-specific ratings. Source: AdStellar, Meta Ads Performance Metrics Explained 2026; AdWhiz, Ad Relevance Diagnostics glossary.
2. "High CTR means the campaign is working"
CTR measures clicks divided by impressions for a specific creative-audience pairing — a relevance and curiosity signal, not a business-outcome signal. The overall Facebook leads-campaign CTR median is 2.59%, per the WordStream 2025 benchmark report. A creative can exceed 2.59% and still produce no qualified results if the conversion rate ranking is Below Average — the click is occurring but the landing page or offer is not converting. The correct diagnostic pair is CTR plus conversion rate, evaluated together. An ad with a 4% CTR and a 1% conversion rate is underperforming relative to one with a 1.5% CTR and a 9% conversion rate on the same budget. The latter produces six times more results at the same spend. High CTR is a prerequisite for efficient CPC, not a standalone success indicator. Dentists & Dental Services carries the lowest average CTR in the WordStream dataset (1.05%) and the highest CPL ($76.71) — structural vertical dynamics, not creative failure.
CTR benchmarks without conversion rate context are incomplete. A 3.92% CTR in Arts & Entertainment and a 1.05% CTR in Dental both produce cost-effective leads in their respective verticals — the benchmark frame is vertical, not universal.
3. "High reach and impressions mean the account is healthy"
Reach and impressions measure delivery volume, not delivery quality. An account with 10 million impressions and a frequency of 4.5 on a cold prospecting audience is a saturated account with rising CPM and declining CTR — not a successful one. Frequency (impressions ÷ reach) is the metric that contextualizes reach: a reach of 100,000 with a frequency of 1.2 is healthy prospecting; a reach of 30,000 with a frequency of 5.8 is audience exhaustion. The correct volume-side diagnostic is the combination of 7-day frequency and 7-day CTR trend, not absolute impression count. MB Adv Agency has found that business owners who receive agency reports foregrounding reach and impressions are systematically unable to identify ad fatigue until cost per result has already deteriorated — often by three to four weeks. Reordering the report to lead with cost per result and frequency resolves this. For reporting template guidance, see Meta Pixel & conversion tracking for how attribution windows affect the cost-per-result figure that should headline any Meta report.
2.59%
US median CTR — Facebook leads campaigns (WordStream 2025, n=726)
$27.66
US median CPL — Facebook leads campaigns (WordStream 2025, n=726)
50
Optimization events per ad set per week to exit the Meta learning phase
3.5
7-day frequency — critical ad fatigue threshold for cold prospecting audiences
Meta Ads Metrics & Reporting: Frequently Asked Questions
Getting a Meta report that leads with reach and impressions but not cost per result?
MB Adv Agency reorders the reporting framework so business owners see the outcome metrics first — cost per result, frequency, and learning phase status — and make decisions on signal, not volume. Covers legal, dental, real estate, and beauty & personal care verticals.
Get an Account Review →Methodology
Performance benchmarks in this article are from the WordStream / LocaliQ Facebook Ads Benchmarks 2025 report (April 1, 2024–June 30, 2025; leads sample n=726 US campaigns; traffic sample n=554 US campaigns; all figures are medians), fetched directly from wordstream.com and cross-referenced with LocaliQ 2025. Ad relevance diagnostic definitions and the 500-impression threshold sourced from Meta Business Help (About Ad Relevance Diagnostics). Learning phase 50-event threshold sourced from AdLibrary and CampaignPros. Frequency thresholds from AdAmigo Frequency Benchmarks (practitioner consensus ranges, not Meta-published). A/B test confidence thresholds from Meta Business Help — About Confidence in Your Tests. CPM and ROAS by industry absent from the WordStream dataset; DTC panel context from Triple Whale Facebook Ads Benchmarks. Reviewed by MB Adv Agency, June 2026.

As a Google Ads expert, I bring proven expertise in optimizing advertising campaigns to maximize ROI.
I specialize in sharing advanced strategies and targeted tips to refine Google Ads campaign management.
Committed to staying ahead of the latest trends and algorithms, I ensure that my clients receive cutting-edge solutions.
My passion for digital marketing and my ability to interpret data for strategic insights enable me to offer high-level consulting that aims to exceed expectations.
Google Partner Agency
We're a certified Google Partner Agency, which means we don’t guess — we optimize withGoogle’s full toolkit and insider support.
Your campaigns get pro-level execution, backed by real expertise (not theory).
4.9 out of 5 from 670+ reviews on Fiverr.
That’s not luck, that’s performance.
Highly recommend Matteo to set up your server side tracking. He has a deep understanding of e-commerce tracking and will go above and beyond to make sure everything is set up correctly and working 100%. If you are scaling your store this set up is non-negotiable in my opinion and there isn't many people who have this much knowledge or put the effort in to get it right. Thanks again!

avorodesign.com
I can only recommend Matteo! He was very patient, professional and very knowledgeable about GA4, Consent Mode v2, and GDPR compliance. Communication was clear, and the setup was done professionally and efficiently. Highly recommend him for anyone needing reliable tracking implementation.

www.natureiki.life
Matteo shines in the realm of online professionals. His work is not only deep in data but also complemented by his proactive communication and cooperation, setting a new standard for freelancers. If you want someone who truly exceeds expectations, look no further. Highly recommended!

www.omanbeverlysmyth.com
Exceptional Service Beyond Expectations - Outstanding Service Impeccable depth, flawless delivery, and exceptional language fluency—this service exceeded all expectations. Highly recommended. Matteo truly ROCKS!!!

ium-paris.com
Top-notch, always highly value working with Matteo. An absolute Google Ads Genius. This is approximately the 8th time I have hired him and he's helped us get 6-7 ROAS. We are excited in continuing to improve our lead flow. Hire this guy if you need Google Ads help. Thanks Matteo!

www.dleeventgroup.com
I finally found the guy who can setup server side tracking and all the ecosystem properly. I definitely recommend Matteo. He is very responsive, kind and wants to dig into things. He configured GA4, Meta, Google Ads, Outbrain and google consent v2 with Cookiebot. Thanks Matteo.

inomega.fr
MB Adv delivered exceptional work with outstanding professionalism and lots of patience, taking time to see effects of changes made and not just do the work and submit it. The proactive communication and video summaries of the work completed made working with Matteo a pleasure, as he consistently went above and beyond. Highly recommended for web analytics projects! We are already working on another project.

www.withnellsensors.co.uk
Working with Matteo on my Google Ads was a game-changer. He's not just a strategist, he's a true partner. He understood my goals and tailored a campaign that perfectly reached my target audience. I'm grateful for his expertise and dedication.

dccargo.com
Click-driven mind
with plastic-brick obsession.
We build Google Ads campaigns with the same mindset we use to build tiny brick worlds: strategy, patience, and zero tolerance for wasted pieces.
Data is our blueprint. Growth is the only acceptable outcome.