Google Ads Quality Score & Ad Rank: 2026 Guide

-37%
CPC discount at Quality Score 8 vs. the QS 5 baseline. On a $9.87 legal services keyword, moving from QS 4 to QS 8 implies a shift from ~$12.34 to ~$6.22 per click.
Source: Adalysis (practitioner estimate) · WordStream Google Ads Benchmarks 2026
What Is Quality Score in Google Ads?
Quality Score is a 1-10 diagnostic metric reported at the keyword level in Google Ads. It is not an auction input. Google states this directly: "Quality Score is not an input in the ad auction. It's a diagnostic tool to identify how ads that show for certain keywords affect the user experience." The number is a backward-looking estimate of how your ad and landing page performed relative to other advertisers on the same exact-match keyword over the prior 90 days.
Three component evaluations determine the score: expected clickthrough rate (eCTR), ad relevance, and landing page experience. Each is rated above average, average, or below average. SEISO's reverse-engineering of 15,000+ accounts — reported by Search Engine Land — found the formula follows a point sum: 1 base point + up to 3.5 for eCTR + up to 3.5 for landing page experience + up to 2.0 for ad relevance = 10 maximum. eCTR and landing page experience each carry ~39% of the formula weight; ad relevance carries ~22%.
Ad Rank — not Quality Score — determines where your ad appears and what you pay. Ad Rank is recalculated at auction time using real-time quality evaluations. The stored 1-10 QS number does not enter that calculation. The correct use of Quality Score is diagnostic: identify which component is below average, fix the structural cause, and watch auction-time performance improve. For how bid strategy interacts with Ad Rank, see Google Ads bidding strategies. For keyword-level QS baselines, see Google Ads keywords and match types.
Key Takeaways
- Quality Score is a diagnostic, not an auction input. Google confirms it explicitly. The stored 1-10 score does not enter the auction; the real-time component evaluations do.
- eCTR and landing page experience each carry ~39% of the QS formula weight — together ~78%. Ad relevance carries ~22%. Prioritize eCTR and LPE first.
- Ad Rank has six inputs, not two. Bid and quality are the two you control. Thresholds, competitiveness, search context, and asset impact shift with every query.
- Quality Score appears in the CPC denominator. QS 8 earns a ~37% CPC discount vs. QS 5 baseline; QS 4 carries a ~25% premium (practitioner estimates, Adalysis).
- In Smart Bidding accounts, visible QS loses predictive power — broad match queries fall outside the exact-match trailing window. Audit component ratings as a structural diagnostic, not a KPI.
- Ad Rank thresholds block low-quality ads regardless of bid. Low impression share despite an adequate bid signals a threshold block. The fix is quality, not a higher bid.
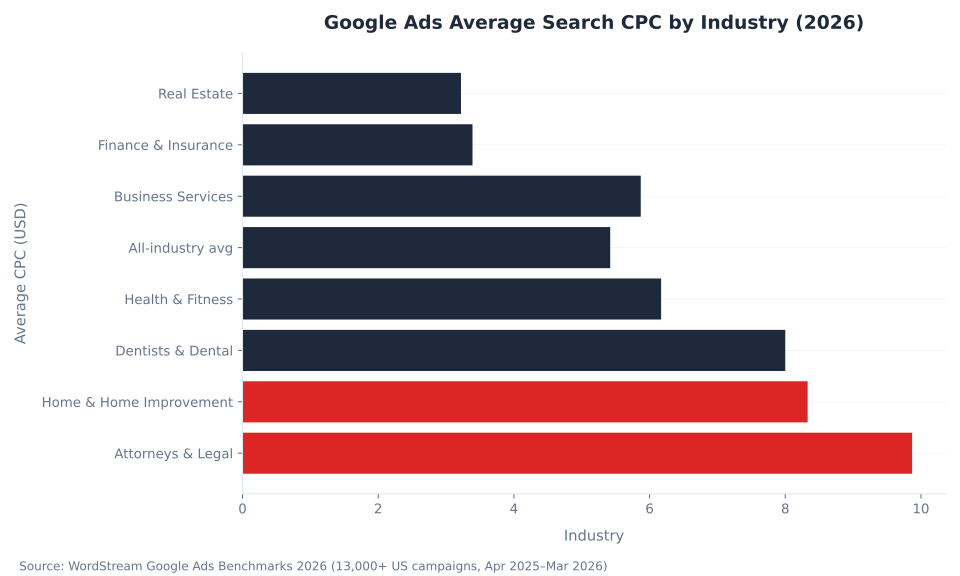
$9.87
Attorneys & Legal Services avg CPC (2026) — highest-CPC vertical where QS management delivers maximum dollar impact
WordStream 2026
6
Ad Rank factors Google uses per auction — bid is one of six; quality, context, thresholds, competitiveness, and assets all shift the outcome
Google Ads Help 2026
39%
Estimated weight of eCTR and landing page experience each in the QS formula — the two highest-leverage components
SEISO / Search Engine Land
The Three Components of Quality Score
Quality Score's three components are each rated above average, average, or below average against other advertisers who showed ads for the exact same search query over the prior 90 days. The comparison uses exact-match performance only — broad match query expansions are not included in the trailing window, which is why broad match keywords frequently show lower visible QS even in well-structured accounts.
| Component | What Google measures | Est. weight | Primary fix lever |
|---|---|---|---|
| Expected CTR | Likelihood the ad is clicked when shown, vs. other ads for the same keyword | ~39% | Tighter ad group structure; intent-specific headlines; A/B testing |
| Ad Relevance | How closely the ad matches the intent behind the user's search | ~22% | Tighter ad group segmentation; match copy language to keyword intent cluster |
| Landing Page Exp. | Relevance and usefulness of the page for users who click | ~39% | Content alignment to keyword; mobile Core Web Vitals; dedicated landing pages |
Weights from SEISO reverse-engineering of 15,000+ accounts via Search Engine Land. Google does not publish official weights. Component definitions: Google Ads Help, About Quality Score (2026).
The SEISO formula: QS = 1 (base) + eCTR points (0-3.5) + LPE points (0-3.5) + ad relevance points (0-2.0). A keyword with all three components at Average scores 5-6 (1 + 1.75 + 1.75 + 1.0 = 5.5). All three above average yields the maximum of 10. The key finding: improving eCTR or LPE has twice the formula impact of improving ad relevance. Fix those two first on any below-average keyword.
eCTR and LPE (~39% each) together account for ~78% of Quality Score. Ad relevance (~22%) is the lower-leverage component. When all three are below average, fix eCTR and LPE first.
Quality Score Is a Diagnostic, Not an Auction Input
Google describes Quality Score as a "warning light for a car's engine" — it signals that something needs attention, but it is not the engine. The 1-10 number is a trailing estimate based on 90-day exact-match comparison data. At auction time, Google evaluates ad quality in real time; that real-time signal feeds Ad Rank. The stored 1-10 score does not. Source: Google Ads Help, Using Quality Score to guide optimizations (2026).
| QS range | What it implies | CPC modifier vs. QS 5 | Action |
|---|---|---|---|
| 9-10 | All three components above average | -44% to -50% | Maintain; monitor CTR decay as ad ages |
| 7-8 | Two or more components above average | -29% to -37% | Healthy baseline; optimize assets and thresholds |
| 5-6 | Mixed; at or near baseline | 0 to -17% | Review which component to push above average |
| 3-4 | At least one component below average | +25% to +67% | Fix below-average component; diagnose root cause |
| 1-2 | Multiple components below average | +150% to +400% | Ad group restructure likely needed |
CPC modifiers: practitioner estimates from Adalysis and Store Growers (2026). Not official Google figures. QS rating implications per Google Ads Help.
The QS number tells you which component failed — not why. A QS 3 with eCTR below average and LPE below average flags two structural gaps; it does not identify whether the eCTR problem is weak ad copy or wrong keyword-to-ad match. The component rating directs the audit; the audit identifies the cause. Track Quality Score component changes alongside Google Ads metrics and KPIs to confirm that component improvements translate to actual CPA movement.
Expected Click-Through Rate: The Highest-Impact Component
Expected CTR (eCTR) is Google's prediction of how likely your ad is to be clicked when shown, compared to other ads for the same exact-match keyword. It carries ~39% of the QS formula weight — equal to landing page experience and twice ad relevance. eCTR is measured against the exact-match competition only, which is why broad match keywords often show below-average eCTR ratings even when the campaigns perform.
| Signal | What drives it | Improvement lever |
|---|---|---|
| Keyword-to-headline relevance | Does the ad copy reflect the query? | Include exact keyword phrase in headline 1 or 2 |
| Historical CTR | 90-day click-to-impression ratio vs. field | A/B test RSA copy; pause low-CTR variants |
| Ad group breadth | One ad serves too many intent variants | Split to 5-10 keywords per group; intent-specific copy per cluster |
| Format completeness | RSA asset pool depth | Populate all 15 RSA headlines and 4 descriptions with distinct copy |
Source: Google Ads Help, Using Quality Score to guide optimizations; Adalysis practitioner synthesis.
Ad group structure is the highest-leverage eCTR fix. A single ad group containing 30 keywords and one RSA produces mediocre eCTR because the ad cannot match the intent of 30 different queries. Splitting into clusters of 5-10 intent-matched keywords — each with RSA headlines targeting that specific query pattern — consistently moves eCTR component ratings from average to above average. MB Adv Agency has found this restructuring approach effective in legal PPC and home services accounts where generic structure dragged eCTR below average on the highest-spend keywords.
RSA Ad Strength is not Quality Score. A Weak Ad Strength score can coexist with an above average eCTR rating if the combinations that actually serve are well-matched to the competition. Track eCTR component status, not Ad Strength, as your quality signal. For how campaign type selection affects which ad formats drive eCTR signals, see the campaign types guide.

Ad Relevance and Landing Page Experience
Ad relevance and landing page experience together account for ~61% of Quality Score. Landing page experience carries the same ~39% estimated weight as eCTR — yet it is the most neglected component in accounts where campaign managers control ad copy but cannot modify landing pages.
Ad Relevance (~22% of QS)
A below-average ad relevance rating almost always traces to a single structural cause: too many semantically unrelated keywords in one ad group competing for one RSA. The fix is structural, not copy-level. Keyword insertion in headlines improves eCTR, not relevance. Ad relevance improves when the thematic intent of the entire ad group matches the query pattern. Source: Google Ads Help, About Quality Score.
Landing Page Experience (~39% of QS)
Google evaluates landing page experience on four dimensions: content relevance to the query, site transparency, ease of navigation, and mobile performance (Core Web Vitals). A keyword with LPE below average and eCTR above average signals that the ad is compelling but the page does not deliver — the bottleneck is the page, not the campaign.
| Factor | Google's signal | Primary improvement action |
|---|---|---|
| Content relevance | Page content matches ad and query intent | Align page headline and first paragraph to ad copy language |
| Mobile performance | Core Web Vitals: LCP, CLS, FID/INP | Optimize images; reduce render-blocking scripts |
| Page load speed | Time to first contentful paint | Compress assets; use PageSpeed Insights recommendations |
| Transparency | Business info visible; privacy policy accessible | Display business name, address, contact above fold |
| Navigation ease | Users find what they need without friction | Remove interstitials; clear CTA above fold |
Source: Google Ads Help, About Quality Score; Using Quality Score to guide optimizations.
MB Adv Agency has found that LPE consistently underperforms in accounts where a single site-wide homepage serves as the landing page for multiple keyword themes. Dedicated pages aligned to specific service queries — even simple, single-purpose pages — regularly lift LPE ratings from average to above average on the highest-spend keywords. This pattern holds across dental PPC, financial services PPC, and SaaS software PPC engagements where multi-service homepages were the default landing destination. The LPE improvement compounds: better landing page experience improves QS, lowers actual CPC, and — on the same page — improves conversion rate simultaneously.

What Is Ad Rank? The Six-Factor Model
Ad Rank is the score Google computes for every ad in every auction — recalculated fresh for every query and independently for every position on the page. It determines whether your ad shows, where it shows, and what you pay. The "Ad Rank = bid x Quality Score" simplification is years out of date. Google's current documentation lists six factors. Source: Google Ads Help, About Ad Rank (2026).
| # | Factor | Advertiser control | Key implication |
|---|---|---|---|
| 1 | Your bid | Direct | Sets ceiling; not the primary position driver on its own |
| 2 | Ad and landing page quality | Direct | Real-time evaluation at auction time — related to QS components but not the stored 1-10 score |
| 3 | Ad Rank thresholds | Indirect (via quality) | Minimum quality floor per position; not published; threshold blocks don't respond to bid increases |
| 4 | Auction competitiveness | None | Changes every query |
| 5 | Search context | None (targeting shapes which contexts you enter) | Device, location, time of day, user signals — identical bids and QS can produce different Ad Ranks in different contexts |
| 6 | Expected impact from ad assets | Direct | Sitelinks, callouts, structured snippets — one of the few pure Ad Rank improvements with no quality tradeoff |
Two advertisers with identical bids and identical QS can have different Ad Ranks on the same query if one has active sitelinks and the other does not. Context signals shift Ad Rank even when nothing in the account changes. Position 1 cannot be locked through bid management alone because four of the six inputs are outside advertiser control. For how bidding strategies interact with the bid factor in Smart Bidding modes, see the bidding strategies guide.
Ad Rank thresholds: minimum quality floors that an ad must clear to show at any position on a given query. Google does not publish these thresholds. A keyword with very low impression share despite an adequate bid is almost certainly threshold-blocked — the fix is improving eCTR, ad relevance, or LPE signals, not raising bids. Source: Google Ads Help, Ad Rank thresholds: Definition. For roofing PPC and HVAC PPC accounts, seasonal demand spikes compound threshold issues — the fix is quality improvement, not seasonal bid escalation.
How Ad Rank Sets Your Actual CPC
Google's auction is a modified second-price system. You pay just enough to beat the Ad Rank of the advertiser immediately below you — rounded up to the nearest $0.01. Google states this directly: "you only pay what's minimally required to clear the Ad Rank thresholds and beat the Ad Rank of the competitor immediately below you." This mechanism is what makes Quality Score a cost-efficiency lever: QS appears in the denominator of the actual CPC calculation. Source: Google Ads Help, Actual cost-per-click (CPC): Definition (2026).
The practitioner-standard rendering of Google's described mechanism — not a formula Google publishes officially:
Actual CPC ≈ (Competitor Ad Rank immediately below you) ÷ (Your Quality Score) + $0.01
| Metric | Advertiser A | Advertiser B |
|---|---|---|
| Max CPC bid | $5.00 | $4.00 |
| Quality Score | 4 | 8 |
| Ad Rank (bid × QS, simplified) | 20 | 32 |
| Wins position 1? | No (Ad Rank 20 < 32) | Yes (Ad Rank 32 > 20) |
| Actual CPC paid | Higher cost, position 2 | (20 ÷ 8) + $0.01 = $2.51 |
Illustrative example per Google Ads Help, Actual CPC and Optmyzr (2026). Simplified bid × QS Ad Rank model used for illustration; Google's full Ad Rank includes four additional factors.
Advertiser B wins position 1 with a lower bid and pays $2.51 — well below the $4.00 max bid — because Quality Score (8) sits in the denominator. Advertiser A's $5.00 bid wins position 2 at comparable cost. Quality Score improvement affects both sides of the CPC equation: it influences Ad Rank (through real-time quality evaluation) and lowers actual CPC through the denominator effect. An advertiser who improves QS from 4 to 8 on a keyword they already win pays less and becomes harder to displace without a material bid increase from the competitor. For managed PPC engagements in competitive markets, see PPC management in Austin, TX and PPC management in Chicago, IL.
CPC Impact by Quality Score Level
The relationship between Quality Score and CPC is documented by Adalysis and Store Growers through practitioner reverse-engineering of Google's CPC formula structure. These are estimates — Google does not publish an official modifier table — but they are consistent across independent sources and reflect the structural relationship the actual-CPC formula implies.
| Quality Score | CPC change vs. QS 5 | Label |
|---|---|---|
| 10 | -50% | Maximum efficiency |
| 9 | -44% | High quality |
| 8 | -37% | Strong quality |
| 7 | -29% | Above average |
| 6 | -17% | Near baseline |
| 5 | 0% (baseline) | All components at Average |
| 4 | +25% | Cost premium begins |
| 3 | +67% | Significant penalty |
| 2 | +150% | Severe penalty |
| 1 | +400% | Maximum penalty |
Practitioner estimates: Adalysis; Store Growers (2026). Not official Google figures.
On a $9.87 legal services keyword (WordStream 2026), the gap between QS 4 (+25%) and QS 8 (-37%) implies a directional CPC range of ~$12.34 vs. ~$6.22 — a ~50% cost differential on the same keyword at the same position. The modifier table is directional, not a guaranteed billing outcome.
How to Diagnose and Improve Quality Score
The diagnostic sequence starts with component ratings, not the 1-10 number. Open the keyword view in Google Ads, add the three QS component columns, and sort by spend descending. Below-average ratings on your highest-spend keywords are the only findings requiring immediate action.
- eCTR below average: Restructure the ad group to 5-10 tightly themed keywords. Rewrite RSA headlines to match intent cluster language. A/B test; pause low-CTR RSA variants. The 90-day comparison window means improvements take time to surface in the rating.
- Ad relevance below average: The ad group is too broad. Break into tighter intent clusters where every keyword maps to the same user goal. The fix is structural — not copy-level headline tweaks.
- LPE below average: Audit content relevance against the keyword and ad copy. Run PageSpeed Insights on mobile. Reduce interstitials. Consider a dedicated landing page if the current URL serves multiple intent clusters.
Prioritize by spend impact. A below-average LPE rating on a $9.87 CPC keyword costs more than the same rating on a $2.00 keyword. Fix in order of dollar exposure, not alphabetically by campaign. Source: Google Ads Help, Using Quality Score to guide optimizations.

Quality Score problems costing you on high-CPC keywords?
MB Adv runs QS audits as part of every Google Ads engagement — diagnosing below-average component ratings and mapping the structural fixes on your highest-spend keywords.
See Legal PPC services →Frequently Asked Questions
What is Quality Score in Google Ads and why does it matter?
Quality Score is a 1-10 diagnostic metric reported at the keyword level in Google Ads. Google confirms it is not an auction input: "Quality Score is not an input in the ad auction. It's a diagnostic tool to identify how ads that show for certain keywords affect the user experience." The number summarizes how your ad and landing page performed relative to other advertisers on the same exact-match keyword over the prior 90 days, across three components: expected CTR, ad relevance, and landing page experience.
It matters for two reasons. First, the component ratings tell you exactly which structural gap to fix. Second, your real-time quality signals — the evaluations underlying QS — appear in the denominator of the actual CPC formula. At $9.87 avg CPC for legal services (WordStream 2026), a directional shift from QS 4 (+25% premium) to QS 8 (-37% discount) implies a per-click cost reduction of roughly 50% on the same keyword at the same position. Source: Google Ads Help, About Quality Score.
What are the three Quality Score components and how is each rated?
The three components are expected CTR (eCTR), ad relevance, and landing page experience (LPE). Google rates each above average, average, or below average, compared to other advertisers who showed ads for the exact same search query over the prior 90 days. The comparison uses exact-match performance only.
SEISO's reverse-engineering of 15,000+ accounts found the score follows a point sum: 1 base + up to 3.5 for eCTR + up to 3.5 for LPE + up to 2.0 for ad relevance = 10 maximum. eCTR and LPE each carry ~39% of the formula weight; ad relevance ~22%. A keyword with all three at Average scores 5-6. The practical implication: improving eCTR or LPE has twice the formula impact of improving ad relevance — fix them first. Source: Search Engine Land, SEISO analysis.
What is Ad Rank and how does Google calculate it?
Ad Rank is the score Google computes for every ad in every auction to determine whether it shows, where it shows, and what you pay. It is recalculated fresh for every query and independently for every position on the page. Six factors determine it: your bid, ad and landing page quality (real-time), Ad Rank thresholds, auction competitiveness, search context (device, location, time of day), and expected impact from ad assets. Source: Google Ads Help, About Ad Rank.
The "Ad Rank = bid x Quality Score" simplification is years out of date. Bid and quality are the two inputs you directly control, but four others shift with every query. Two advertisers with identical bids and identical QS can have different Ad Ranks on the same query if one has active sitelinks and the other does not — assets are an explicit Ad Rank factor. Position 1 cannot be locked through bid management alone.
How does Quality Score affect my actual CPC — with a worked calculation?
Quality Score affects actual CPC through the denominator of the pricing formula. The practitioner-standard rendering (not an officially published Google formula): Actual CPC ≈ (Competitor Ad Rank immediately below you) ÷ (Your Quality Score) + $0.01. A higher Quality Score in the denominator means you pay less for the same position.
Worked example: Advertiser A bids $5.00 with QS 4 (simplified Ad Rank 20). Advertiser B bids $4.00 with QS 8 (simplified Ad Rank 32). B wins position 1. What does B pay? (A's Ad Rank 20) ÷ (B's QS 8) + $0.01 = 2.50 + $0.01 = $2.51. B wins the top position with a lower bid and pays $2.51 — well below the $4.00 max bid — because QS 8 sits in the denominator. A's $5.00 bid buys position 2 at comparable cost. Source: Google Ads Help, Actual cost-per-click: Definition.
Does Quality Score still matter if I'm using Smart Bidding?
The visible 1-10 QS number loses predictive power as a standalone KPI in Smart Bidding accounts using broad match. The QS calculation uses 90-day exact-match trailing data; broad match queries that expand outside that window depress the visible score even when campaigns hit ROAS targets. Optmyzr's 2026 analysis documents accounts where broad match keywords show QS 2-3 while converting at target ROAS. Source: Optmyzr, Does Quality Score Still Matter in 2026?.
The underlying quality signals — eCTR, ad relevance, LPE — still govern CPCs and Ad Rank in every auction regardless of bidding mode. Smart Bidding optimizes bids in real time; it does not compensate for a landing page that does not match the ad, or for ads producing below-average eCTR against competition. The correct use in Smart Bidding accounts: audit component ratings as a structural diagnostic. A below-average LPE rating is a real signal requiring a real page fix.
What is an Ad Rank threshold and why won't my ad show despite adequate bids?
Ad Rank thresholds are minimum quality floors Google sets for each position on each query. An ad must clear the threshold to show at that position — regardless of bid. Google does not publish these thresholds; they vary by query, position, and context. Source: Google Ads Help, Ad Rank thresholds: Definition.
The diagnostic signature of a threshold block: impression share does not respond to bid increases. If raising the bid from $5.00 to $8.00 produces no impression share improvement, the barrier is quality, not budget. The fix is improving the component ratings — eCTR, ad relevance, or LPE — that the real-time quality evaluation uses to assess the ad against the threshold. In plumbing PPC and similar local service accounts, threshold blocks on competitive near-me queries are common when landing pages serve multiple service areas without location-specific content.
Want a Quality Score and Ad Rank audit for your account?
MB Adv Agency works with legal, dental, home services, and SaaS advertisers on Google Ads quality optimization.
Get in touch →Methodology
Primary sources: Google Ads Help documentation verified Q2 2026 — About Quality Score, Using Quality Score to guide optimizations, About Ad Rank, Ad Rank thresholds, and Actual cost-per-click: Definition. QS formula weights: SEISO analysis of 15,000+ accounts via Search Engine Land. CPC modifier table: Adalysis; Store Growers (2026). Smart Bidding analysis: Optmyzr (2026). Industry benchmarks: WordStream 2026; WordStream 2025. Reviewed by MB Adv Agency, Q2 2026.

As a Google Ads expert, I bring proven expertise in optimizing advertising campaigns to maximize ROI.
I specialize in sharing advanced strategies and targeted tips to refine Google Ads campaign management.
Committed to staying ahead of the latest trends and algorithms, I ensure that my clients receive cutting-edge solutions.
My passion for digital marketing and my ability to interpret data for strategic insights enable me to offer high-level consulting that aims to exceed expectations.
Google Partner Agency
We're a certified Google Partner Agency, which means we don’t guess — we optimize withGoogle’s full toolkit and insider support.
Your campaigns get pro-level execution, backed by real expertise (not theory).

4.9 out of 5 from 670+ reviews on Fiverr.
That’s not luck, that’s performance.
Highly recommend Matteo to set up your server side tracking. He has a deep understanding of e-commerce tracking and will go above and beyond to make sure everything is set up correctly and working 100%. If you are scaling your store this set up is non-negotiable in my opinion and there isn't many people who have this much knowledge or put the effort in to get it right. Thanks again!
avorodesign.com
I can only recommend Matteo! He was very patient, professional and very knowledgeable about GA4, Consent Mode v2, and GDPR compliance. Communication was clear, and the setup was done professionally and efficiently. Highly recommend him for anyone needing reliable tracking implementation.

www.natureiki.life
Matteo shines in the realm of online professionals. His work is not only deep in data but also complemented by his proactive communication and cooperation, setting a new standard for freelancers. If you want someone who truly exceeds expectations, look no further. Highly recommended!

www.omanbeverlysmyth.com
Exceptional Service Beyond Expectations - Outstanding Service Impeccable depth, flawless delivery, and exceptional language fluency—this service exceeded all expectations. Highly recommended. Matteo truly ROCKS!!!

ium-paris.com
Top-notch, always highly value working with Matteo. An absolute Google Ads Genius. This is approximately the 8th time I have hired him and he's helped us get 6-7 ROAS. We are excited in continuing to improve our lead flow. Hire this guy if you need Google Ads help. Thanks Matteo!

www.dleeventgroup.com
I finally found the guy who can setup server side tracking and all the ecosystem properly. I definitely recommend Matteo. He is very responsive, kind and wants to dig into things. He configured GA4, Meta, Google Ads, Outbrain and google consent v2 with Cookiebot. Thanks Matteo.

inomega.fr
MB Adv delivered exceptional work with outstanding professionalism and lots of patience, taking time to see effects of changes made and not just do the work and submit it. The proactive communication and video summaries of the work completed made working with Matteo a pleasure, as he consistently went above and beyond. Highly recommended for web analytics projects! We are already working on another project.

www.withnellsensors.co.uk
Working with Matteo on my Google Ads was a game-changer. He's not just a strategist, he's a true partner. He understood my goals and tailored a campaign that perfectly reached my target audience. I'm grateful for his expertise and dedication.

dccargo.com
Click-driven mind
with plastic-brick obsession.
We build Google Ads campaigns with the same mindset we use to build tiny brick worlds: strategy, patience, and zero tolerance for wasted pieces.
Data is our blueprint. Growth is the only acceptable outcome.