Amazon Ads vs Google Ads: Different Funnels 2026
$69.3B
US retail media ad spending in 2026 — up 17.9% from $58.79B in 2025 — with Amazon holding ~79.7% of that market. Meanwhile Google's US search ad share fell below 50% for the first time in over 20 years.
Source: eMarketer Retail Media Ad Spending Forecast H1 2026 & US Search Advertising Forecast 2026
Amazon Ads vs Google Ads: Two Different Funnels, One Purchase
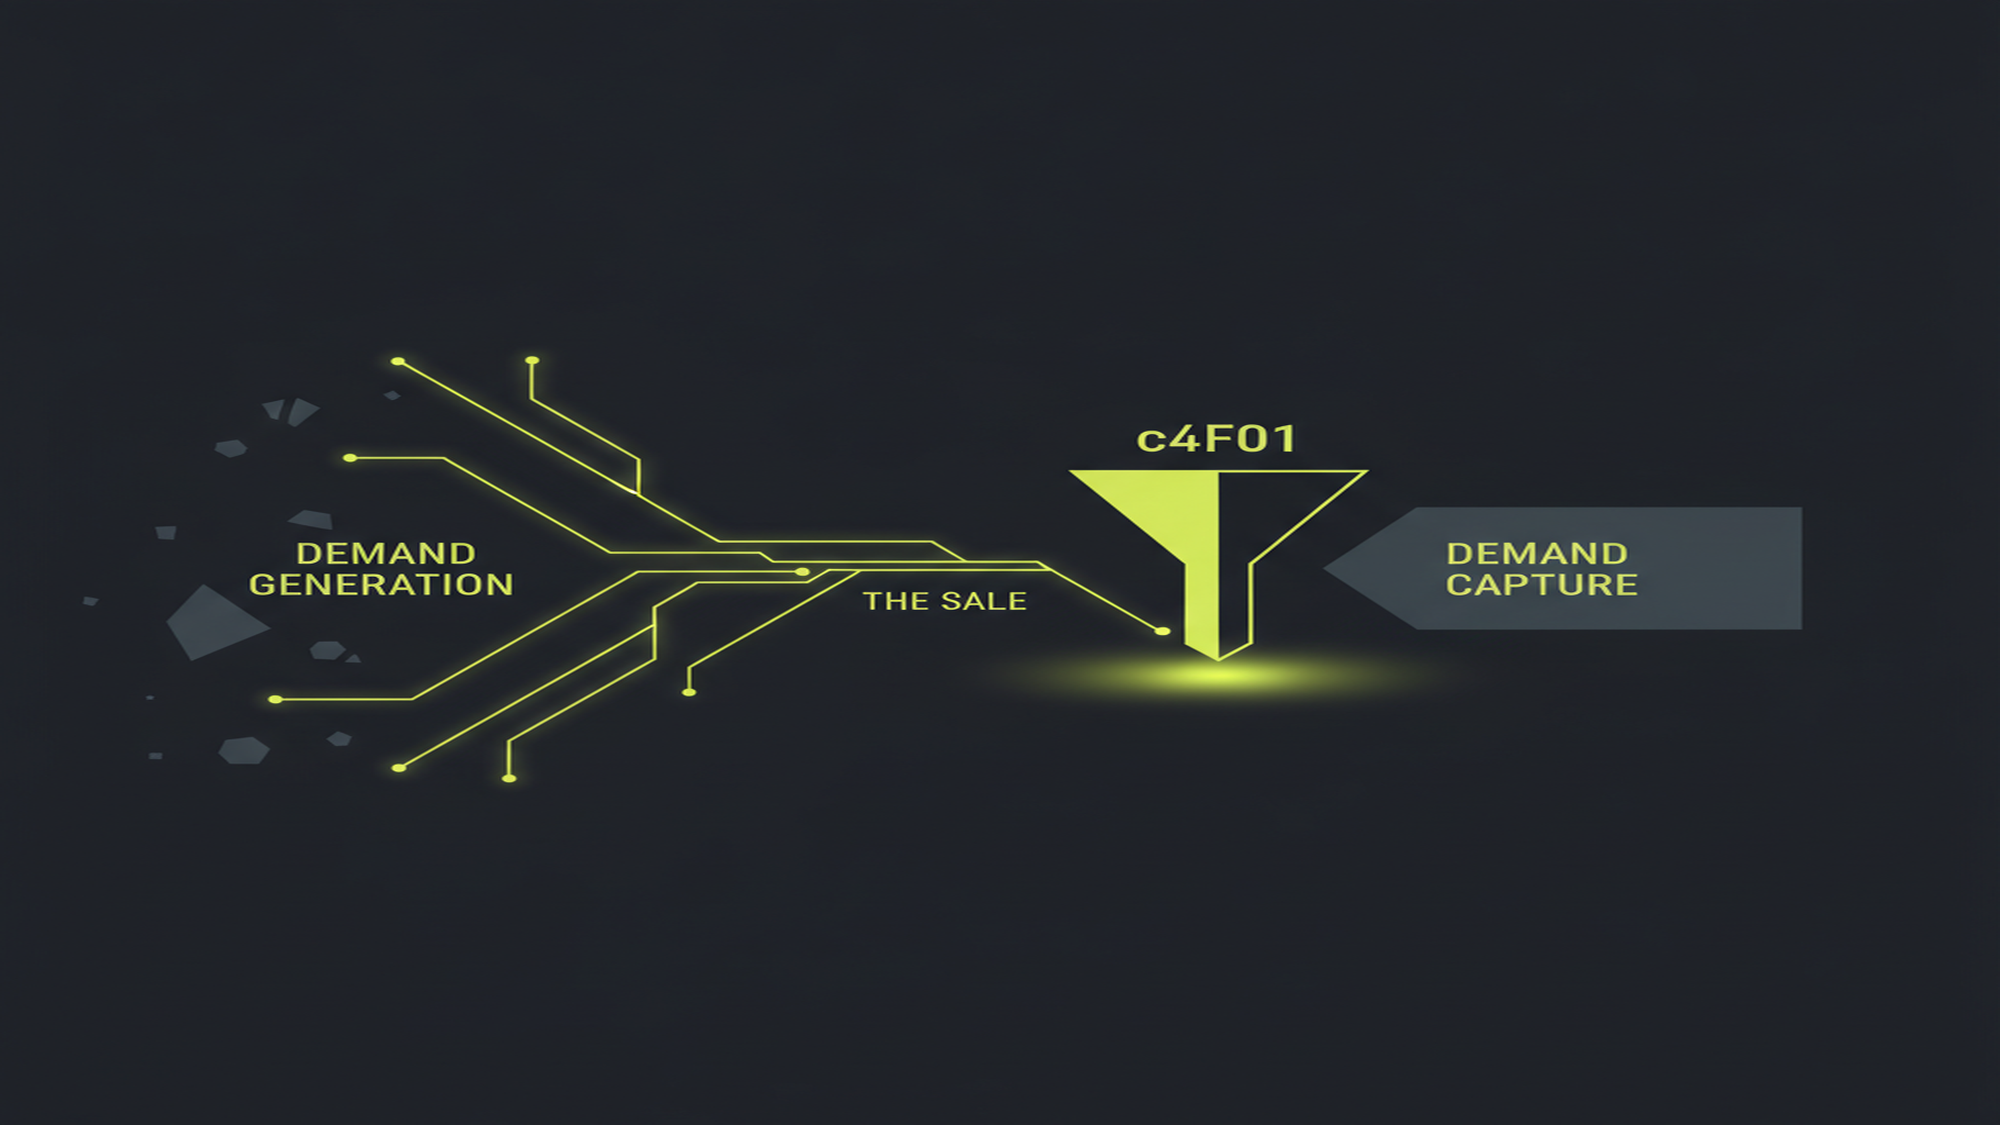
Amazon Ads is a retail media network — ads inside a store, shown to shoppers already mid-purchase, converting on Amazon's own checkout against first-party purchase data. Google Ads is an open-web platform spanning Search, Shopping, Performance Max, Display, and YouTube, reaching people from the first research query through to the final buy. These are different instruments for different jobs.
The phrase "Amazon Ads vs Google Ads" implies a head-to-head with one winner. That is the wrong frame. WebFX puts it directly: Amazon captures shoppers at the moment of purchase; Google creates the demand that leads to that moment. Most e-commerce brands that sell on Amazon run both — the real decision is the split and how each platform gets measured. New to the Amazon side? Start with what Amazon Ads is.
Amazon Ads runs through three self-service ad types — Sponsored Products, Sponsored Brands, and Sponsored Display — all inside the Amazon store, with conversion on Amazon's checkout rather than your site. The managed tier, Amazon DSP and Streaming TV, extends reach off-Amazon, but attribution still flows back through Amazon's closed-loop first-party data. Google Ads has no equivalent data moat: its attribution is cross-web and model-dependent. Google spans the full funnel — Search, Shopping, Performance Max, Display, YouTube, and Demand Gen — which makes it the demand-generation engine Amazon is not, and is why a head-to-head CVR comparison misleads: Amazon shows ads only to in-market shoppers already in a buying context.
The market numbers confirm the two-platform reality.
eMarketer's H1 2026 forecast puts US retail media ad spending at $69.33 billion in 2026, up from $58.79 billion in 2025, with Amazon holding ~79.7% of that market. eMarketer's US Search Advertising Forecast 2026 projects Google earning 48.5% of US search ad spend in 2026 — first time below 50% in over 20 years. Both pools are growing; sophisticated e-commerce brands compete in both.
This pillar covers the four dimensions where the platforms diverge — cost (ACOS vs CPA/ROAS, CPC by category), shopper intent and funnel position, attribution (closed-loop first-party vs cross-web modeled), and ad formats — and closes with a budget-split decision framework. All cost benchmarks are vendor-specific: Amazon from Trellis (platform data, March 2026) and Insider Intelligence 2025 via Bridgeway Digital; Google from WordStream/LocaliQ 2026 (13,474 US campaigns, April 2025–March 2026). The two columns in every table use different vendors and are not directly comparable. For the DTC brands in our client mix spanning skincare, supplements, and home goods, the Amazon vs Google allocation question comes up at nearly every quarterly review.
Key Facts at a Glance
Amazon Ads = demand capture (retail media, first-party purchase data, ACOS). Google Ads = demand generation + capture (open web, Search through YouTube, CPA/ROAS). Most e-commerce brands that sell on Amazon run both; the split — not the choice — is the decision.
- CPC gap, sourced separately: Amazon Sponsored Products CPC $0.75–$3.50+ by category (Trellis, Mar 2026); Google all-industry search CPC $5.42 (WordStream/LocaliQ 2026, Google + Microsoft search). Different vendors, different platforms — not directly comparable.
- CVR by context: Amazon Sponsored Products CVR 10–15% (Trellis midpoint 12.5%); Google all-industry search CVR 8.18% (WordStream/LocaliQ 2026). Amazon's higher CVR reflects in-store, purchase-ready audience context — not absolute platform superiority.
- Metric architecture: Amazon efficiency metric = ACOS (ad spend ÷ ad sales; break-even ACOS = your profit margin). Google efficiency metrics = CPA and target ROAS. ACOS and ROAS are reciprocals (25% ACOS = 4× ROAS) but measure completely different conversion surfaces and must not be compared head-to-head.
- Retail media growth: US retail media reaches $69.33 billion in 2026 (+17.9%); Amazon holds ~79.7% of US retail media (eMarketer H1 2026). Google's US search ad share: 48.5% in 2026 — first time below 50% in 20+ years (eMarketer).
- Attribution divergence: As of January 1, 2026, Amazon retired the 14-day view-through window for store ads in favor of a shopping-signal ML last-touch model. Click-through attribution is unchanged. Google uses data-driven attribution (DDA) by default since retiring rule-based models in 2023.
- Hybrid advantage: Advertisers running Amazon and Google together report "up to 42% higher ROI" versus single-channel (Bridgeway Digital, citing Insider Intelligence 2025). For brands that sell on Amazon, both platforms is the default operating mode.
Amazon Ads vs Google Ads: At a Glance
Amazon Ads is a retail media network measuring on-Amazon sales against first-party purchase data, with ACOS as the efficiency headline. Google Ads is an open-web platform measuring off-platform conversions via data-driven attribution and target ROAS or CPA. The table below maps the structural differences across eight key dimensions.
| Dimension | Amazon Ads | Google Ads |
|---|---|---|
| Category | Retail media network (ads inside a store) | Search + display advertising across the open web |
| Core job | Demand capture (bottom of funnel) | Demand generation + capture (full funnel) |
| Shopper intent | Transactional — already shopping to buy | Mixed — informational through transactional |
| Where the sale happens | On Amazon (its checkout) | Off-platform — your own site or store |
| Main formats | Sponsored Products / Brands / Display, DSP, Streaming TV | Search, Shopping, Performance Max, Display (GDN), YouTube, Demand Gen |
| Headline metric | ACOS / ROAS / TACOS | CPA / ROAS / conversion value |
| Attribution | Closed-loop, first-party purchase data (no cookies required) | Data-driven, cross-device, cross-web (tag/CRM-dependent) |
| Customer data ownership | Amazon owns the shopper data and checkout | Traffic lands on your site; you keep the data and email |
| Best when | You sell on Amazon and want to win the purchase moment | You want new demand, brand defense, and traffic you own |
Sources: Amazon Ads official product guides; WebFX, "Amazon Ads vs. Google Ads"; Bridgeway Digital, "Google Ads vs Amazon Ads 2026"; shared verified-facts file (retail-media framing, format list, ACOS/ROAS/TACOS, Jan-2026 attribution model); Google Ads Help, data-driven attribution.
The "which is better" framing fails because the two platforms answer different questions. Amazon is the shelf you win at the moment of purchase — a shopper there is already in a buying context, searching a product category, about to check out. Google is the journey that gets people there: informational queries, comparison searches, YouTube reviews, and high-intent keywords that drive traffic to your site. Amazon and Google serve the same purchase dollar from opposite ends of the funnel.
For ecommerce brands in categories like electronics, furniture, and pet supplies, the choice is rarely "either/or." The real question is how much of a fixed budget goes to Amazon's demand-capture and how much to Google's demand-generation. The cost, CVR, attribution, and format comparisons below inform that split; the Amazon-side execution — bidding, placement modifiers, budget pacing — lives in Amazon Ads bidding and budgets.
Cost Comparison: CPC, CVR, and ROAS by Platform
Amazon Sponsored Products CPC runs $0.75–$3.50+ by category (Trellis, March 2026); Google all-industry search CPC is $5.42 (WordStream/LocaliQ 2026). The gap is an intent gap in disguise, not a bargain: Amazon's lower CPC reflects a narrower, purchase-ready audience, while Google's higher CPC buys reach across the full funnel, including the awareness and research stages Amazon never pays for.
| Metric | Amazon Ads | Google Ads |
|---|---|---|
| Avg CPC | $0.75–$3.50+ by category (Trellis Mar 2026); ~$0.89 blended cross-category (Insider Intelligence 2025 via Bridgeway) | $5.42 all-industry search (WordStream/LocaliQ 2026, Google + Microsoft, 13,474 campaigns) |
| Avg conversion rate | SP: 10–15% (Trellis midpoint 12.5%); cross-format blended 9.55% (Insider Intelligence 2025 via Bridgeway) | 8.18% all-industry search (WordStream/LocaliQ 2026) |
| Avg CTR | SP: 0.3–0.6%; SB: 0.2–0.4%; SD: 0.1–0.3% (Trellis Mar 2026) | 6.64% all-industry search (WordStream/LocaliQ 2026) |
| Primary efficiency metric | ACOS = ad spend ÷ ad sales; break-even ACOS = your pre-ad profit margin | CPA = cost per acquisition; paired with target ROAS / conversion value in smart bidding |
| ROAS (head-to-head) | 5.2× (Insider Intelligence 2025 via Bridgeway) — on-Amazon closed-loop purchase | 4.1× (Insider Intelligence 2025 via Bridgeway) — off-platform tag-observed conversion. Not apples-to-apples — different measurement universes. |
| Billing model | CPC (SP/SB/SD); vCPM/CPM (some SD, DSP); CPM (Streaming TV) | CPC (Search/Shopping); CPM/CPV (Display, YouTube); smart bidding to tCPA/tROAS |
| What the number measures | On-Amazon sales inside a closed first-party loop | Tag/CRM-observed conversions, often off-platform, modeled cross-device |
Source discipline: Amazon figures from Trellis Amazon Advertising Benchmarks 2026 and Bridgeway Digital / Insider Intelligence 2025. Google figures from WordStream/LocaliQ 2026 (Google + Microsoft search, 13,474 US campaigns, Apr 2025–Mar 2026). Never cross-apply: WordStream/LocaliQ benchmarks cover Google/Microsoft search only. Amazon and Google cells use different vendors and are not directly comparable.
The ROAS comparison above — Amazon 5.2× vs Google 4.1× (Insider Intelligence 2025 via Bridgeway Digital) — is directionally useful but not apples-to-apples: Amazon ROAS counts on-Amazon closed-loop sales, Google ROAS counts modeled off-site conversions. Stacking the two to declare a winner is a category error. For full ACOS↔ROAS↔CPA translation, see Amazon Ads ACOS, ROAS, and metrics.
A cost-per-conversion estimate from the vendor figures: Amazon Sponsored Products at $0.89 CPC and 9.55% CVR (Insider Intelligence 2025 via Bridgeway) is about $9.32 per Amazon conversion; Google search at $5.42 CPC and 8.18% CVR (WordStream/LocaliQ 2026) is about $66.26 per Google conversion. Amazon's implied cost looks dramatically lower, but the two measure different things — an on-Amazon retail sale with first-party data vs an off-platform site conversion across a full-funnel audience. The comparison shows the intent gap, not a reason to move budget without weighing what each job is worth.
Amazon CPC by Product Category (Trellis, March 2026)
Amazon Sponsored Products CPC ranges from $0.70 for Toys & Games to $1.50 for Beauty & Personal Care and Grocery — well below Google's all-industry search average of $5.42. The chart shows category midpoints against the Google blended reference line. These are different vendors measuring different platforms; the gap reflects intent, not a simple price advantage.
| Product Category | CPC Range (USD) | Midpoint Used in Charts |
|---|---|---|
| Toys & Games | $0.70–$1.00 | $0.85 |
| Clothing, Shoes & Jewelry | $0.85–$0.95 | $0.90 |
| Office Products | $0.85–$1.05 | $0.95 |
| Kitchen & Dining | $0.90–$1.10 | $1.00 |
| Home & Kitchen | $0.95–$1.10 | $1.03 |
| Sports & Outdoors | $0.90–$1.20 | $1.05 |
| Tools & Home Improvement | $0.95–$1.20 | $1.08 |
| Health & Household | $1.10–$1.40 | $1.25 |
| Grocery & Gourmet Food | $1.20–$1.50 | $1.35 |
| Beauty & Personal Care | $1.20–$1.50 | $1.35 |
| Google Ads blended all-industry search CPC: $5.42 (WordStream/LocaliQ 2026) — shown as reference only; no per-Amazon-category Google equivalent is sourceable from the same vendor. | ||
Source: Trellis, "Amazon Advertising Benchmarks 2026 Update" — platform aggregated data, published March 11, 2026. CPC ranges reflect Sponsored Products self-service campaigns; actual performance varies by listing quality, competition, pricing, and placement. Not mbadv data.
Several patterns emerge from the Trellis data. Categories with high product discovery — Beauty & Personal Care, Grocery — show higher CPCs because shelf competition is intense and the purchase occasion is frequent. Categories where price and spec comparison drives search — Electronics, Tools — also trend above the platform average, though Trellis does not publish electronics as a separate line because its variation is too wide to state as a range. For brands running kitchen appliances PPC or sports equipment PPC on Amazon, category CPC is a starting point for bid planning, not a guarantee.
The Google $5.42 all-industry figure (WordStream/LocaliQ 2026) has no per-Amazon-category equivalent — the two providers cover different platforms and taxonomies, and a category-level Amazon vs Google CPC comparison sourced to one vendor does not exist publicly. The chart shows Amazon category midpoints alongside Google's blended reference as a labeled single-bar reference, not a matched comparison. For beauty products PPC or baby products PPC campaigns, both budgets inform the overall CAC stack — not substitutes, but complementary capture and generation spend.
Conversion Rate: Amazon Ad Formats vs Google Ads
Amazon Sponsored Products converts at 10–15% (Trellis midpoint 12.5%); Google all-industry search CVR is 8.18% (WordStream/LocaliQ 2026). Amazon's higher CVR is structural: it shows ads only to shoppers already in a purchase-ready retail context, while Google covers the full funnel, including awareness and research stages that convert lower by design.
| Format / Platform | CVR | What it measures | Source |
|---|---|---|---|
| Amazon Sponsored Products | 10–15% (midpoint 12.5%) | On-Amazon purchase, closed-loop first-party | Trellis Mar 2026 |
| Amazon Sponsored Brands | 8–12% (midpoint 10.0%) | On-Amazon purchase, closed-loop first-party | Trellis Mar 2026 |
| Amazon Sponsored Display | 5–10% (midpoint 7.5%) | On- and off-Amazon purchase, first-party | Trellis Mar 2026 |
| Amazon cross-format blended | 9.55% | On-Amazon purchase, blended all formats | Insider Intelligence 2025 via Bridgeway Digital |
| Google Ads search — all-industry | 8.18% | Off-platform tag-observed conversion (your site) | WordStream/LocaliQ 2026 (13,474 campaigns, Google + Microsoft) |
Critical note: Amazon CVR = on-Amazon purchase in a closed retail environment. Google CVR = off-platform tag-observed conversion on your own site, modeled cross-device. These are not the same measurement. A head-to-head CVR comparison treats different definitions as equal — which is why Amazon's higher CVR does not mean Amazon "converts better" in any universal sense. Sources: Trellis Mar 2026; Bridgeway/Insider Intelligence 2025; WordStream/LocaliQ 2026. Not mbadv data.
The Bridgeway Digital head-to-head (Insider Intelligence 2025) reports Amazon CVR at 9.55% vs Google at 3.75%. That lower Google figure (vs WordStream's 8.18%) reflects a blended campaign-type mix or different date range — the methodology is not fully disclosed. For the Google column above, WordStream/LocaliQ 2026 (13,474 US campaigns, April 2025–March 2026, medians) is the preferred figure: the larger, more recent, clearly-stated dataset covering search-only campaigns. When citing the Bridgeway head-to-head, use its stated 3.75% with full attribution.
The practical insight: Amazon's high CVR reflects purchase-ready in-store intent, while Google's CVR spans a far wider intent range — high-intent search queries convert near or above Amazon's rate, broad awareness queries well below it. Comparing one blended CVR from each platform without accounting for intent mix is how brands reach the wrong conclusion about which "performs better." For brands in jewelry PPC or shoes PPC, Google Shopping CVR — product-level comparison intent — runs materially higher than Google's blended search rate.
Amazon Sponsored Products CPC by Category vs Google Ads Blended CPC (2026 Vendor Estimates)

Intent and Funnel Position: Where Each Platform Operates
Amazon Ads is dominant at purchase capture — shoppers who arrive on Amazon are already mid-buy, and Sponsored Products intercepts them at the category or branded-keyword level. Google Ads covers awareness, consideration, and purchase capture across the open web via search queries, shopping signals, and behavioral audiences. The two do not compete at the same funnel stage.
| Funnel Stage | Amazon Ads | Google Ads |
|---|---|---|
| Awareness | Limited — DSP and Streaming TV extend beyond the purchase moment to off-Amazon placements and connected TV | Strong — YouTube, Display (GDN), Demand Gen reach across the open web |
| Consideration / research | On-Amazon browse and compare only — shoppers within Amazon's ecosystem | Strong — informational queries, comparison searches, review content |
| Purchase capture | Dominant — Sponsored Products and Sponsored Brands in front of ready-to-buy shoppers at the shelf | Strong — Search and Shopping on high-intent transactional queries |
| Data backbone | First-party purchase and browse data — what people buy on Amazon | Search intent + cross-web behavioral signals — what people seek across the web |
| Reach universe | Amazon shoppers (+ off-Amazon audiences via DSP) | Search, YouTube, Gmail, Maps + millions of partner sites and apps via GDN |
| Geographic targeting | Marketplace/locale level on self-service; granular geo in Amazon DSP only — no city or radius targeting on Sponsored ads | City, radius, DMA — full geo controls on all campaign types |
| Customer relationship | Amazon owns the shopper account, purchase history, and checkout — brand cannot contact buyers directly | Traffic lands on your site; you collect email, build first-party data, own the repeat-purchase relationship |
Sources: WebFX, "Amazon Ads vs. Google Ads"; Bridgeway Digital, "Google Ads vs Amazon Ads 2026"; Amazon Ads official geo-targeting documentation (Sponsored ads = marketplace-level only; DSP = granular geo). The "customer relationship" row reflects a strategic reality widely documented by practitioners.
The customer-relationship row is the strategic fact most brands underweight in an "Amazon only" approach. On Amazon, the shopper is Amazon's customer — the brand cannot access the email, build a retargeting list from purchase data (without Amazon DSP custom audiences), or own the repeat-purchase journey. On Google, every click that lands on your site is a relationship the brand owns: email capture, first-party pixel data, retargeting, and loyalty. For categories where lifetime value matters — skincare PPC, supplements and nutrition PPC, home goods PPC — the long-term argument for Google is the relationship asset, not just the conversion.
Targeting granularity follows the same split. Amazon's self-service Sponsored ads target at the marketplace and locale level — no city or radius parameter in the Sponsored Products or Brands console, and granular geo exists only inside Amazon DSP. Google offers city, radius, and DMA targeting on every campaign type, so brands that need local-intent capture cannot replicate Google Local with Amazon's self-service tier. Amazon's targeting options are purpose-built for retail media: keywords, ASINs, product categories, and purchase- and browse-based audience segments.
Conversion Rate: Amazon Ad Formats vs Google Ads Search (2026 Vendor Estimates)

Ad Format Comparison: Amazon Ads vs Google Ads
Amazon Ads has five main format tiers: Sponsored Products, Sponsored Brands, Sponsored Display (self-service CPC/vCPM), Amazon DSP (managed programmatic CPM), and Streaming TV (CTV CPM). Google Ads has six format families: Search, Shopping, Performance Max, Display (GDN), YouTube, and Demand Gen. The overlap is full-funnel automation: Amazon's Performance+ and Google's Performance Max both use ML, but on entirely different data and conversion surfaces.
| Format | Platform | Funnel Stage | Billing | Primary Use Case |
|---|---|---|---|---|
| Sponsored Products | Amazon Ads | Purchase capture | CPC | Keyword and ASIN targeting; direct product sales on Amazon — the workhorse format for most brands |
| Sponsored Brands | Amazon Ads | Awareness + capture | CPC / vCPM | Brand headline + product grid above search results; drives brand discovery within Amazon |
| Sponsored Display | Amazon Ads | Remarketing + awareness | CPC / vCPM | Retargets shoppers on and off Amazon using Amazon audience signals |
| Amazon DSP | Amazon Ads | Full funnel | CPM | Programmatic display and video off-Amazon; first-party audience segments; managed spend |
| Streaming TV (STV) | Amazon Ads | Awareness | CPM | Connected TV ads on Prime Video and Fire TV; brand reach at scale beyond the store |
| Search (text ads) | Google Ads | High-intent capture | CPC | Keyword-triggered; highest-intent query interception on Google search and partner networks |
| Shopping | Google Ads | Comparison + capture | CPC | Product listing ads with image, price, and merchant name; primary DTC e-commerce format on Google |
| Performance Max | Google Ads | Full funnel | Smart bidding | ML-driven distribution across all Google surfaces; replaces Smart Shopping; requires strong conversion data to optimize effectively |
| Display (GDN) | Google Ads | Awareness + remarketing | CPM / CPC | Banner and responsive display on partner sites; retargeting + prospecting across the open web |
| YouTube | Google Ads | Awareness + consideration | CPV / CPM | Video ads pre-roll, mid-roll, and bumpers; brand storytelling and product demonstration at scale |
| Demand Gen | Google Ads | Consideration | CPM | Social-style audience targeting on YouTube feeds and Gmail; lookalike expansion beyond known audiences |
Note: Amazon's automated performance campaign type is Performance+ (within Amazon DSP) — not to be confused with Google's Performance Max. Both use ML-driven automation, but they run on entirely separate platforms with different data sources and conversion surfaces. Sources: Amazon Ads official product documentation; Google Ads Help center; Channable, "Google Ads vs Amazon Ads".
A naming note: Amazon's current brand is Amazon Ads (not "Amazon Advertising" or the legacy "AMS"). Never write "Performance Max" for Amazon — its equivalent automated format is Performance+, which operates within Amazon DSP. Conflating the two causes platform-mechanic errors in setup and reporting.
The format split also clarifies the audience-ownership point from the funnel table. Every Amazon format — SP, SB, SD, DSP, STV — converts inside Amazon's closed ecosystem, so the brand's customer data stays with Amazon. Every Google format drives traffic to a URL the brand controls, where customer-data collection is the brand's asset. For brands in electronics PPC or home goods PPC running both an Amazon presence and a DTC site, format strategy maps directly to channel-ownership strategy.
US Retail Media Ad Spending 2025 vs 2026 (eMarketer H1 2026 Forecast)

Retail Media Market Context: The Budget Shift
US retail media ad spending reaches $69.33 billion in 2026, up 17.9% from $58.79 billion in 2025, with Amazon holding ~79.7% of the US retail media market. Over the same period, Google's US search ad share falls below 50% for the first time in over 20 years — a structural shift, not a substitution, with both pools growing and Amazon capturing the incremental dollar.
| Metric | Figure | Source |
|---|---|---|
| US retail media ad spend — 2025 | $58.79 billion | eMarketer H1 2026 forecast |
| US retail media ad spend — 2026 | $69.33 billion (+17.9% YoY) | eMarketer H1 2026 forecast |
| Amazon's share of US retail media (2025) | ~79.7% | eMarketer FAQ on Retail Media Networks 2026 |
| Amazon + Walmart share of incremental 2026 retail media dollars | ~89% | eMarketer FAQ on Retail Media Networks 2026 |
| Walmart Connect share of US retail media (2025) | ~8.0% (second-largest US RMN) | eMarketer |
| Google's share of US search ad spend — 2026 | 48.5% — first time below 50% in 20+ years | eMarketer US Search Advertising Forecast 2026 |
| Amazon US search ad revenue growth rate — 2026 est. | +17.6% | eMarketer US Search Advertising Forecast 2026 |
| Google US search ad revenue growth rate — 2026 est. | +7.6% | eMarketer US Search Advertising Forecast 2026 |
Sources: eMarketer, "Retail Media Ad Spending Forecast H1 2026"; eMarketer, "US Search Advertising Forecast 2026". Note: eMarketer H2 2025 forecast projected $71.09B for 2026; H1 2026 revision = $69.33B. Use H1 2026 figures with source attribution. All figures paywalled; chart-page headlines confirm directional values. Not mbadv data.
Key framing: The retail media shift does not mean brands are dropping Google for Amazon — eMarketer shows both growing in absolute terms. What is shifting is the incremental dollar: new budget flows disproportionately into retail media, with Amazon and Walmart capturing ~89% of that incremental spend. For most e-commerce brands, this is additive, not a trade-off.
The market context also explains why the "Amazon is eating Google's lunch" narrative is half right. Amazon's US search ad revenues are growing 17.6% vs Google's 7.6% (eMarketer 2026) — Amazon is taking search-intent budget because shoppers increasingly start product searches on Amazon. But Google still reaches shoppers earlier, dominates non-product informational search, and runs the only full-funnel platform that converts traffic to your own site. The answer for most ecommerce brands is to fund each for the job it does and measure it on that job's own metric, not to choose by growth rate.
For brands managing both channels, the frame is simple: retail media is growing faster, and Google remains dominant in open-web search and brand building. For brands in home goods PPC, furniture PPC, or pet supplies PPC, build Amazon spend as a baseline that captures existing demand and use Google to expand the addressable market and generate demand that flows through Amazon or your DTC site.
Attribution: Closed-Loop First-Party vs Cross-Web Modeled
Amazon attribution is closed-loop and first-party — it sees the actual purchase because it owns the checkout. As of January 1, 2026, Amazon retired the legacy 14-day view-through window for store ads and DSP vCPM billing for a shopping-signal ML last-touch model. Google uses data-driven attribution (DDA) by default, ML-weighted across all touchpoints, since retiring rule-based models in 2023.
| Attribute | Amazon Ads | Google Ads |
|---|---|---|
| Data source | First-party purchase data — Amazon owns the transaction and sees the actual sale | Tag-observed + signed-in user + CRM import — cross-web, cross-device, modeled |
| Attribution model | Shopping-signal ML last-touch (as of Jan 1, 2026 for store ads/DSP vCPM). Older 14-day "all views" available in parallel in Unified Reporting. | Data-driven attribution (DDA) — ML-weighted across all touchpoints in the customer journey. Default since rule-based models retired in 2023. |
| Click-through window | 7-day (SP/SB); 14-day (SD) — unchanged by the Jan 2026 model update | 30-day default (adjustable per conversion action) |
| View-through window | New ML model for store ads and DSP vCPM (shorter, signal-weighted — credits "brand discovery moments" only). Offsite DSP delivery: traditional 14-day click/view unchanged. | 1-day default in DDA (adjustable) |
| Cookie dependency | None — first-party purchase data, no third-party cookies required | Modeled via signed-in Google accounts; resilient to third-party cookie loss but dependent on tracking tag setup and CRM import |
| Off-platform conversion tracking | Not applicable for Sponsored ads (on-platform only). Amazon DSP offsite: traditional 14-day click/view lookback (unaffected by Jan 2026 change). | Offline Conversion Tracking (OCT) and enhanced conversions import CRM data and in-store purchases back into Google Ads |
| Jan 2026 reporting impact | View-through ROAS appears 15–30% lower for SD and DSP campaigns (PPC.land); "double-digit declines in attributed DSP view-through revenue" (Code3) — measurement change, not performance decline | Not applicable — no equivalent model change in 2026 |
Sources: Amazon Ads official, "View Attribution Updates for Amazon Store Ads" (Jan 1 2026 model change; click windows unchanged; "all views" legacy option); PPC.land, "Amazon Tightens View Attribution" (15–30% lower view-through ROAS); Code3, "Amazon Quietly Tightened Attribution" (double-digit declines — measurement, not performance); Google Ads Help, "About Data-Driven Attribution". Not mbadv data.
The January 2026 Amazon attribution change matters for advertisers comparing ROAS pre- and post-change. Under the old model, any ad view within 14 days of a purchase could claim credit; under the new ML model, only views at "brand discovery moments" — exploratory browse and category search — receive credit. View-through ROAS for Sponsored Display and DSP appears 15–30% lower in 2026 reporting (PPC.land), and Code3-managed DSP advertisers see "double-digit declines in attributed DSP view-through revenue." These are measurement changes — actual sales are not declining; the legacy "all views" 14-day metric stays accessible in Unified Reporting (labeled "Purchases (all views)"). Full detail on Amazon's attribution mechanics is in Amazon Ads ACOS, ROAS, and metrics.
Google's data-driven attribution is structurally different: it assigns credit probabilistically across every touchpoint, using machine learning to weight each interaction by its observed contribution to conversion. A YouTube awareness view, a Display remarketing impression, and a final Search click all receive fractional credit — not just the last click. DDA is also cross-device, stitching the journey across phones, tablets, and desktops via signed-in accounts, and imports off-platform conversions via Offline Conversion Tracking. The picture is broader but modeled, dependent on tracking quality. Amazon's attribution is narrower (on-Amazon, Sponsored ads) but more certain. Neither is "more accurate" — they are accurate about different things.
When to Use Each Platform and How to Split Budget
For most ecommerce brands that sell on Amazon: run both platforms, set a separate efficiency target for each, and measure them independently. Amazon's target is break-even ACOS (your profit margin). Google's target is a CPA or new-customer acquisition cost your LTV model supports. Bridgeway Digital cites a 60/40 Amazon-to-Google split as one illustrative starting point for a sale-focused brand; invert for DTC-first brands.
| Your situation or goal | Lean toward | Reason |
|---|---|---|
| You sell primarily on Amazon and want efficient immediate sales | Amazon Ads | Captures purchase-ready shoppers at the shelf; lower CPC and higher CVR on its own metric (ACOS) |
| You need new demand and want traffic + customer data you own | Google Ads | Generates demand across awareness and consideration; drives traffic to a site you control; builds first-party data |
| You sell on both Amazon and your own DTC site | Both — deliberate split | Google builds the demand; Amazon seals the purchase. Hybrid advertisers report "up to 42% higher ROI" vs single-channel (Bridgeway/Insider Intelligence 2025) |
| You need granular local or radius targeting | Google Ads | City and radius controls on every Google campaign type; Amazon self-service geo is marketplace-level only (DSP offers granular geo) |
| You want to defend your brand name in search | Both | Brand defense on Amazon (Sponsored Brands on your own name) prevents competitors from taking the branded shelf. Brand defense on Google (Branded Search) prevents competitors from hijacking your search SERP. |
| You are DTC-only (no Amazon presence) | Google Ads | Amazon Ads requires a product listing on Amazon to drive traffic to. Without an Amazon presence, only Google and other open-web channels are available. |
| Illustrative starting split — sale-focused ecommerce brand on Amazon (vendor example) | 60% Amazon / 40% Google | One cited example from Bridgeway Digital. The correct split is test-driven and category-dependent — never copy a single vendor's example without running your own ACOS and CPA targets first. |
Sources: Bridgeway Digital, "Amazon Advertising vs Google Ads: Which Drives Better ROI?" (hybrid 42% ROI premium; illustrative 60/40 split); Channable, "Google Ads vs Amazon Ads"; Amazon Ads official geo-targeting docs. The 42% ROI premium and 60/40 split are vendor-cited starting points — NOT mbadv client results and NOT guaranteed outcomes. The correct allocation depends on where you sell, each platform's own target metric, and test results.
MB Adv Agency applies a clear rule when setting initial splits: fund Amazon to its break-even ACOS first, then direct the rest to Google for the demand-generation and brand-defense work Amazon cannot do. The review is always quarterly and uses each platform's own metric — never a side-by-side ROAS comparison of two different measurement surfaces. For brands running jewelry PPC or shoes PPC, the split logic holds even when the absolute allocation differs by category CPC and margin.
The hybrid ROI premium from Bridgeway (Insider Intelligence 2025) — "up to 42% higher ROI" vs single-channel — is attributed to that vendor, not mbadv client data. Directionally it reflects demand-gen (Google) feeding demand-capture (Amazon): Google creates new-to-brand awareness that converts on Amazon, which captures it with lower friction and higher CVR. The two platforms are additive, not competitive. For budget-allocation mechanics on the Amazon side, see Amazon Ads bidding and budgets.
Illustrative Amazon vs Google Budget Split by Ecommerce Brand Type (Editorial Guidance)

Running Amazon Ads and Google Ads — but not sure how to split budget between them?
MB Adv Agency works with ecommerce brands on retail media and open-web search together — setting the right ACOS target on Amazon and the right CPA on Google, then measuring each on its own metric.
See our ecommerce PPC work →Three Misconceptions About Amazon Ads vs Google Ads
The "Amazon Ads vs Google Ads" framing invites three recurring errors that cause brands to mis-allocate budget and compare incompatible metrics. Each is refutable from the data above.
Misconception 1: "It's Amazon or Google — pick the cheaper, higher-converting one."
Amazon and Google are not substitutes competing for the same click. Amazon captures shoppers at the point of purchase using first-party data; Google generates and captures demand across the open web, with conversion on your own site. Picking "the cheaper one" on CPC ignores that Amazon's lower CPC reflects a narrower, purchase-ready audience (WebFX; Bridgeway Digital 2026), while Google's higher CPC buys reach across stages Amazon never pays for. MB Adv Agency corrects this framing with new ecommerce clients: optimizing against the wrong comparison drives under-investment in whichever platform does not look cheaper on its own metric.
Misconception 2: "Amazon's lower CPC and higher CVR prove it's the better platform — shift budget there."
Lower CPC and higher CVR are structural features of a closing-stage retail-media channel, not evidence of platform superiority. Amazon shows ads only to in-market shoppers already on a purchase mission, so its clicks are cheaper and convert more often. Scale Insights and Bridgeway Digital both note this context. Google pays to work the research, comparison, and awareness stages Amazon never touches — the work that creates the demand Amazon later captures. The correct question is whether Amazon is hitting its ACOS target and Google its CPA or new-customer target. If both are yes, fund both more and put the next dollar where it generates the most incremental value.
Misconception 3: "Amazon ROAS and Google ROAS are the same number — compare them directly."
ACOS and ROAS share a formula; Amazon ROAS and Google ROAS do not share a measurement universe. Amazon ROAS counts on-Amazon sales inside a closed first-party loop — it sees the actual purchase because Amazon owns the checkout. Google ROAS counts conversions your tags observe on your own site, modeled cross-device via data-driven attribution. The Bridgeway/Insider Intelligence 2025 head-to-head (Amazon 5.2× vs Google 4.1× ROAS) is a directionally useful single-vendor read, but stacking the two figures to declare a winner is a category error (ecomBrainly; Google Ads Help). Map ACOS↔ROAS↔CPA to understand each platform individually — then stop.
ACOS, ROAS, and CPA: Translating Metrics Across Platforms
ACOS and ROAS are reciprocals: 25% ACOS = 4× ROAS, and break-even ACOS equals your pre-ad gross profit margin. Google's equivalent is CPA, set against a target ROAS in smart bidding. The translation is mathematical, but the measurement surfaces differ — and treating them as equivalent is the source of most cross-platform budget errors.
| ACOS | Equivalent ROAS | Interpretation |
|---|---|---|
| 10% | 10× | Highly efficient; only achievable in low-competition categories with strong listing CVR |
| 20% | 5× | Above break-even for brands with ~25%+ gross margin; strong performer on Sponsored Products |
| 25% | 4× | Comfortable for brands with 30%+ gross margin; at or below break-even for tighter-margin products |
| 33% | 3× | Typical for competitive mid-tier categories; break-even for brands with ~33% gross margin |
| 50% | 2× | Above break-even only for high-margin products (50%+); loss-making for most Amazon sellers |
Formula: ROAS = 1 ÷ ACOS (as decimal); ACOS = 1 ÷ ROAS × 100%. Break-even ACOS = your pre-ad gross profit margin. Source: ecomBrainly, "ACoS vs. ROAS: Which Metric Should Amazon Sellers Really Track?" Example: $500 ad spend ÷ $2,000 ad-attributed sales = 25% ACOS = 4.0× ROAS. If your gross margin is 30%, break-even ACOS is 30% — this 25% ACOS leaves a 5-point buffer. Not mbadv data.
MB Adv Agency finds the brands that struggle most with cross-channel allocation are those comparing Amazon ROAS and Google ROAS side by side without accounting for what each number measures. Amazon ROAS counts on-Amazon sales in a closed loop; Google ROAS counts modeled cross-device conversions on your own site. Setting one ROAS target and expecting both platforms to hit it is a structural mistake.
The translation workflow for an omnichannel brand:
- Identify your pre-ad gross margin per product — it sets Amazon's break-even ACOS.
- Set a target ACOS at or below break-even for Sponsored Products; for new-category entry, accept a higher ACOS to buy share and track TACOS (total ad spend ÷ total Amazon revenue including organic).
- Set a separate Google CPA target from your LTV model — new-customer CPA, not blended, since returning customers inflate the figure.
- Run each platform to its own target and rebalance quarterly, never by the gap between the two ROAS numbers.
For brands in baby products PPC or kitchen appliances PPC, the ACOS targets on Amazon and CPA targets on Google are category-specific — set by category CPC, CVR, and product margin, not a platform-agnostic benchmark. The full metric framework for the Amazon side is in Amazon Ads ACOS, ROAS, and metrics.
Frequently Asked Questions
The questions below cover the core decision points for ecommerce brands evaluating Amazon Ads, Google Ads, or both — from cost translation to attribution mechanics to budget split logic.
What is the difference between Amazon Ads and Google Ads?
Amazon Ads is a retail media network — its ads run inside Amazon's store, in front of shoppers already in a buying context, with conversion on Amazon's own checkout using first-party purchase data. Its efficiency metric is ACOS: ad spend ÷ ad-attributed revenue. Google Ads is an open-web platform spanning Search, Shopping, Performance Max, Display, YouTube, and Demand Gen, reaching people at every stage, with conversion on your own site via cross-device, data-driven attribution. Amazon captures demand that already exists at the moment of purchase; Google generates demand and then captures it. For most brands that sell on Amazon, running both is the default.
Is Amazon Ads cheaper than Google Ads?
Amazon Sponsored Products CPC ranges from $0.75 to $3.50+ by category (Trellis, March 2026), with a cross-category blended average around $0.89 (Insider Intelligence 2025 via Bridgeway Digital). Google all-industry search CPC is $5.42 (WordStream/LocaliQ 2026, Google + Microsoft search, 13,474 US campaigns). Amazon's lower CPC reflects a narrower, purchase-ready audience, not a price advantage: Amazon serves only shoppers on a purchase mission, while Google covers awareness, research, comparison, and the buy. Cost-per-conversion from the figures: Amazon at $0.89 CPC and 9.55% CVR is about $9.32; Google at $5.42 CPC and 8.18% CVR is about $66.26 — different surfaces, different vendors. Never cross-apply.
Should I run Amazon Ads or Google Ads for my ecommerce brand?
If you sell on Amazon, run Amazon Ads — it is the dominant demand-capture mechanism for purchase-ready shoppers, and skipping it hands competitors the shelf you leave open. Whether to also run Google Ads turns on two factors: whether you want new demand that does not yet exist on Amazon, and whether you want to own the customer relationship (email, first-party data, repeat purchase). Google generates demand across the open web, before shoppers know what they want. Bridgeway Digital (Insider Intelligence 2025) reports hybrid advertisers achieving up to 42% higher ROI versus single-channel. For most established ecommerce brands, the answer is both — with a deliberate split and separate targets.
What is ACOS and how does it compare to Google's CPA?
ACOS (advertising cost of sales) is Amazon's primary efficiency metric: ad spend ÷ the Amazon revenue those ads generated, as a percentage. Spend $500 to generate $2,000 in Amazon sales and ACOS = 25%, ROAS = 4×. If your pre-ad gross margin is 30%, break-even ACOS is 30% — the 25% leaves a 5-point buffer (ecomBrainly). ACOS and ROAS are reciprocals (25% ACOS = 4× ROAS; 20% = 5×). Google's equivalent is CPA, with a target ROAS in smart bidding. Amazon ACOS counts on-Amazon purchases in a closed loop; Google CPA counts tag-observed conversions on your site, modeled cross-device. Same formula family, different measurement universe.
How does Amazon's attribution model differ from Google's in 2026?
Amazon uses closed-loop, first-party attribution: it owns the transaction, sees the actual purchase, and credits the ad within the conversion window. As of January 1, 2026, Amazon retired the legacy 14-day view-through window for store ads and DSP vCPM billing for a shopping-signal ML last-touch model that credits views at brand-discovery moments rather than all views in a flat window. Click-through attribution is unchanged (7-day SP/SB, 14-day SD). PPC.land reports view-through ROAS 15–30% lower for Sponsored Display and DSP under the new model — a measurement change, not a performance decline. Google uses data-driven attribution by default since 2023: ML-weighted across all touchpoints, cross-device via signed-in users.
How do I split my budget between Amazon Ads and Google Ads?
Start from the job each platform does. Amazon Ads captures purchase-ready demand where you sell; Google Ads generates new demand and drives traffic you own or defends your brand on search. Set a separate target for each: break-even ACOS for Amazon (your profit margin), and a CPA or new-customer acquisition cost for Google from your customer LTV model. Fund Amazon first if you sell there, then give Google the demand-generation and brand-defense work Amazon cannot do. Bridgeway Digital cites 60% Amazon / 40% Google as one illustrative starting point for a sale-focused brand; DTC-first brands invert it. Rebalance quarterly on each platform's own metric, never by comparing the two ROAS figures.
Not sure how to set the split between Amazon's demand capture and Google's demand generation?
MB Adv Agency works with ecommerce brands on both platforms — setting ACOS targets on Amazon and CPA targets on Google, measuring each on its own metric. Get a retail-media + search consult.
Talk to our team →Methodology
Cost benchmarks (CPC, CVR, CTR, ROAS, ACOS) are sourced from platform-specific vendors: Amazon figures from Trellis platform data (March 2026) and Insider Intelligence 2025 via Bridgeway Digital; Google figures from WordStream/LocaliQ 2026 (13,474 US campaigns, Google + Microsoft search, April 2025–March 2026, medians). Retail media market figures from eMarketer H1 2026 forecast and US Search Advertising Forecast 2026. Attribution model details from Amazon Ads official documentation (January 2026 model change), PPC.land, Code3, and Google Ads Help. No Amazon and Google figures share a vendor — the two platforms are not tracked by equivalent providers — and Amazon figures are never cross-applied to Google columns or vice versa. No mbadv client metrics are cited; all agency POV is qualitative. Reviewed by MB Adv Agency, June 2026.

As a Google Ads expert, I bring proven expertise in optimizing advertising campaigns to maximize ROI.
I specialize in sharing advanced strategies and targeted tips to refine Google Ads campaign management.
Committed to staying ahead of the latest trends and algorithms, I ensure that my clients receive cutting-edge solutions.
My passion for digital marketing and my ability to interpret data for strategic insights enable me to offer high-level consulting that aims to exceed expectations.
Google Partner Agency
We're a certified Google Partner Agency, which means we don’t guess — we optimize withGoogle’s full toolkit and insider support.
Your campaigns get pro-level execution, backed by real expertise (not theory).
4.9 out of 5 from 670+ reviews on Fiverr.
That’s not luck, that’s performance.
Highly recommend Matteo to set up your server side tracking. He has a deep understanding of e-commerce tracking and will go above and beyond to make sure everything is set up correctly and working 100%. If you are scaling your store this set up is non-negotiable in my opinion and there isn't many people who have this much knowledge or put the effort in to get it right. Thanks again!

avorodesign.com
I can only recommend Matteo! He was very patient, professional and very knowledgeable about GA4, Consent Mode v2, and GDPR compliance. Communication was clear, and the setup was done professionally and efficiently. Highly recommend him for anyone needing reliable tracking implementation.

www.natureiki.life
Matteo shines in the realm of online professionals. His work is not only deep in data but also complemented by his proactive communication and cooperation, setting a new standard for freelancers. If you want someone who truly exceeds expectations, look no further. Highly recommended!

www.omanbeverlysmyth.com
Exceptional Service Beyond Expectations - Outstanding Service Impeccable depth, flawless delivery, and exceptional language fluency—this service exceeded all expectations. Highly recommended. Matteo truly ROCKS!!!

ium-paris.com
Top-notch, always highly value working with Matteo. An absolute Google Ads Genius. This is approximately the 8th time I have hired him and he's helped us get 6-7 ROAS. We are excited in continuing to improve our lead flow. Hire this guy if you need Google Ads help. Thanks Matteo!

www.dleeventgroup.com
I finally found the guy who can setup server side tracking and all the ecosystem properly. I definitely recommend Matteo. He is very responsive, kind and wants to dig into things. He configured GA4, Meta, Google Ads, Outbrain and google consent v2 with Cookiebot. Thanks Matteo.

inomega.fr
MB Adv delivered exceptional work with outstanding professionalism and lots of patience, taking time to see effects of changes made and not just do the work and submit it. The proactive communication and video summaries of the work completed made working with Matteo a pleasure, as he consistently went above and beyond. Highly recommended for web analytics projects! We are already working on another project.

www.withnellsensors.co.uk
Working with Matteo on my Google Ads was a game-changer. He's not just a strategist, he's a true partner. He understood my goals and tailored a campaign that perfectly reached my target audience. I'm grateful for his expertise and dedication.

dccargo.com
Click-driven mind
with plastic-brick obsession.
We build Google Ads campaigns with the same mindset we use to build tiny brick worlds: strategy, patience, and zero tolerance for wasted pieces.
Data is our blueprint. Growth is the only acceptable outcome.