Construction PPC Statistics 2026
Construction PPC — Average Cost Per Click
across 39 US cities — 2.4× the $5.31 national benchmark (LocalIQ 2025)
Why Does Construction PPC Behave Differently From Other Home Services?
Construction buyers are not in crisis — they are comparison-shopping. A homeowner planning a kitchen remodel spends 2–8 weeks reading reviews, studying portfolios, requesting multiple quotes, and verifying contractor licensing before submitting a single contact form. This deliberate buying cycle is why LocalIQ's 2025 national benchmark shows a 2.61% CVR for construction — and why city-level optimized campaigns in our dataset average 7.25%.
The decision cycle varies sharply by project sub-type. Kitchen and bath remodels carry a 2–8 week research window; homeowners request multiple competing quotes and portfolio reviews. Basement finishing and room additions compress to 1–4 weeks in lower-competition markets, where one strong local contractor often wins without a bidding war. Full renovations and general contracting engagements extend to 4–12 weeks, with contractor licensing, bonding, and project references becoming primary drivers. Emergency repair work — storm damage, foundation failures — mimics HVAC urgent-response behavior, with shorter cycles and higher CVR.
What makes this decision cycle commercially compelling is ticket size. Our dataset median CPL is $140. At a 30% close rate on a $25,000 kitchen remodel, each closed lead generates $7,500 in gross revenue — a 54:1 revenue-to-CPL ratio. The industry's low CVR and high deliberation period are features, not bugs: they filter out tire-kickers and deliver buyers who have already committed to the project. According to NAHB's 2026 remodeling sector report, 41% of US homeowners now hire construction professionals, up from 40% in 2024.
Labor shortage multiplier: 82% of US construction firms report difficulty filling craft positions and 41% of the workforce retires by 2031, per AMTEC's 2026 Workforce Report. In a labor-constrained market, a qualified PPC lead is capacity optimization — not just a sales opportunity.
The Harvard Joint Center for Housing Studies' Leading Indicator of Remodeling Activity projects residential remodeling spending will reach $522 billion by end of 2026, growing 2.9% in early 2026 before moderating. The remodeling industry now counts 128,000+ firms — nearly double the fewer than 69,000 firms in 2000. That supply-side expansion drives more advertisers competing for the same high-intent renovation keywords, which is the primary driver of the CPC premium our city-level data captures above national aggregates.
Construction PPC Statistics 2026: Key Takeaways
- Average CPC is $12.50 across 39 US cities in MB Adv Agency's dataset — 2.4× the LocalIQ 2025 national benchmark of $5.31. The gap reflects city-level competition on high-intent renovation keywords, not data error — the national average blends rural markets, broad-match campaigns, and informational queries.
- Our median CPL of $140.00 is 15% below the national benchmark of $165.67 despite CPC running 2.4× higher. The mechanism: our campaigns convert at a 7.25% median CVR vs. 2.61% nationally. More clicks convert — fewer dollars wasted — resulting in a lower cost per actual lead.
- Portland and Seattle are the most affordable large markets at $4.48 CPC — less than one-third of the dataset median. Both are Pacific markets with strong renovation demand but lower Google Ads advertiser density in the construction category.
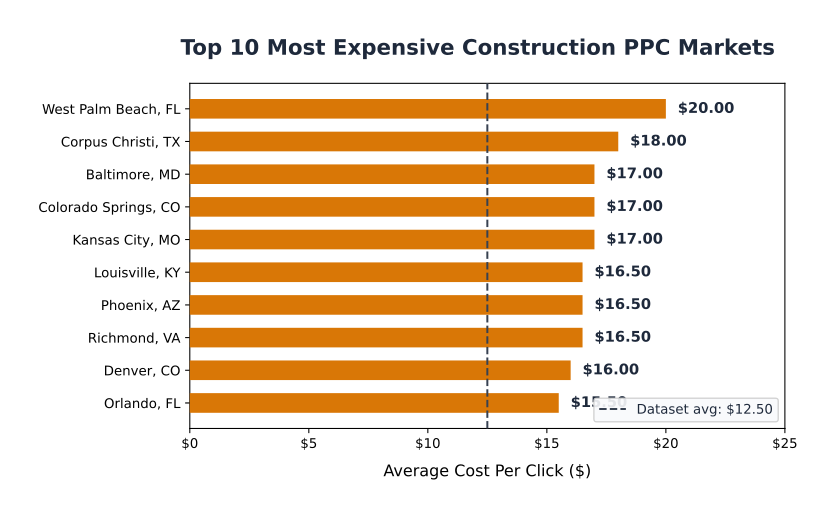
- West Palm Beach leads all cities at $20.00 CPC, followed by Corpus Christi, TX ($18.00) and Baltimore, MD, Colorado Springs, CO, and Kansas City, MO — all at $17.00. Southeast and West markets dominate the high-CPC bracket.
- Colorado Springs achieves the highest CVR in the dataset at 12% — nearly 5× the national benchmark — driven by renovation-specific keyword targeting in a mid-tier market with lower competitive density than the major metros.
- The Southwest delivers the lowest regional CPL at $120.62, anchored by Corpus Christi's $70.00 — the single-city record. Combined with a 6.25% regional CVR, Southwest markets generate more leads per dollar than any other region.
- A median starter budget of $2,750/month generates 19–20 construction leads at current CPL rates. At a 30% close rate and $25,000 average project ticket, that is 6 signed contracts and $150,000 in gross revenue per month.
- 97% of homeowners use Google to find local contractors, per Blue Grid Media's 2026 contractor advertising analysis — making Google Search the dominant acquisition channel for residential construction leads.
- The US remodeling market is projected to reach $522 billion in 2026, per Harvard JCHS, with remodeling firm count nearly doubling over 25 years — increasing paid search competition and driving CPC above national averages in competitive markets.
- No other public source publishes city-level construction PPC benchmarks. LocalIQ publishes one national figure; WordStream's closest proxy blends construction with landscaping and cleaning services. MB Adv Agency's 39-city dataset is the only granular public source for construction PPC cost data by market.
Construction PPC Quick Reference — 39 US Cities
National benchmarks: LocalIQ 2025 — $5.31 CPC / $165.67 CPL / 2.61% CVR. Our city-level data consistently outperforms these figures on CPL and CVR.
How Do Construction PPC Benchmarks Compare to National Averages?
MB Adv Agency's city-level construction PPC data shows a $12.50 mean CPC across 39 US markets — 2.4× the LocalIQ national figure of $5.31. The counterintuitive finding: our campaigns simultaneously deliver a 15% lower CPL ($140 vs. $165.67) because they convert at nearly 3× the national CVR rate.
This is the efficiency paradox at the core of construction PPC. LocalIQ's 2025 Home Services benchmarks report construction as having the lowest CVR (2.61%) and lowest CPC ($5.31) of all 16 home services categories — seemingly contradictory until you understand what the national average captures. That figure blends rural markets, broad-match campaigns on generic queries like "construction company," and informational searches that are nowhere near a purchase decision. Our data comes from active campaigns targeting "kitchen remodel contractor [city]" and "general contractor [city]" — high-intent queries where buyers are ready to request quotes.
WordStream's 2026 Google Ads benchmarks do not publish construction as a standalone category. Their closest proxy — "Home & Home Improvement" at $8.33 CPC and 8.05% CVR — blends construction with landscaping, cleaning, and handyman services. It directionally supports the argument that home improvement advertisers optimizing for intent outperform industry averages. For cross-industry context, our HVAC PPC statistics show an identical pattern: city-level median CPC running 2–3× the national benchmark while delivering below-benchmark CPL.
| Metric | MB Adv Agency (39 Cities) | LocalIQ 2025 (National) | WordStream 2026 (Home & Home Improvement Proxy) |
|---|---|---|---|
| Avg CPC | $12.50 | $5.31 | $8.33 |
| Avg CPL | $140.00 (median) | $165.67 | $90.92 |
| Avg CVR | 7.25% (median) | 2.61% | 8.05% |
| Geographic Scope | 39 US cities (city-level) | National aggregate | National aggregate (blended category) |
| Construction Standalone | Yes | Yes | No (home improvement proxy) |
Our roofing PPC statistics confirm the same pattern: city-level data runs 2–3× above national aggregates. If your construction campaigns show CPCs far above $5.31, your data is correct.
What Does Construction PPC Cost in Each City?
West Palm Beach, FL leads at $20.00 CPC — 1.60× the dataset average — while Portland, OR and Seattle, WA deliver clicks at $4.48, less than one-third of the median. According to MB Adv Agency's analysis of 39 US cities, construction PPC costs vary 4.5× from the most to least expensive markets, driven by advertiser density, sub-market competition, and keyword intent specificity.
The Southeast and West dominate the expensive bracket, while Pacific and Midwest markets offer entry-level CPC well below the dataset mean. Notably, some of the largest US metros — Houston, TX ($11.00) and Los Angeles, CA ($10.00) — rank among the most affordable, disproving the assumption that population drives CPC. Advertiser density and keyword specificity matter more than city size.
| City | Avg CPC | CPC Range | Region | Cost Index |
|---|---|---|---|---|
| West Palm Beach, FL | $20.00 | $12–$28 | Southeast | 1.60× |
| Corpus Christi, TX | $18.00 | $8–$28 | Southwest | 1.44× |
| Baltimore, MD | $17.00 | $12–$22 | Southeast | 1.36× |
| Colorado Springs, CO | $17.00 | $12–$22 | West | 1.36× |
| Kansas City, MO | $17.00 | $12–$22 | Midwest | 1.36× |
| Louisville, KY | $16.50 | $12–$21 | Southeast | 1.32× |
| Phoenix, AZ | $16.50 | $8–$25 | Southwest | 1.32× |
| Richmond, VA | $16.50 | $12–$21 | Southeast | 1.32× |
| Denver, CO | $16.00 | $12–$20 | West | 1.28× |
| Orlando, FL | $15.50 | $11–$20 | Southeast | 1.24× |
| Salt Lake City, UT | $15.50 | $11–$20 | West | 1.24× |
| Raleigh, NC | $15.50 | $11–$20 | Southeast | 1.24× |
| Memphis, TN | $14.50 | $10–$19 | Southeast | 1.16× |
| Pittsburgh, PA | $14.50 | $10–$19 | Northeast | 1.16× |
| Minneapolis, MN | $14.00 | $8–$20 | Midwest | 1.12× |
| Jacksonville, FL | $12.50 | $5–$20 | Southeast | 1.00× |
| Boise, ID | $11.50 | $8–$15 | West | 0.92× |
| Cincinnati, OH | $11.00 | $8–$14 | Midwest | 0.88× |
| Honolulu, HI | $11.00 | $8–$14 | Pacific | 0.88× |
| Houston, TX | $11.00 | $4–$18 | Southwest | 0.88× |
| City | Avg CPC | CPC Range | Region | Cost Index |
|---|---|---|---|---|
| Portland, OR | $4.48 | $2.56–$6.40 | Pacific | 0.36× |
| Seattle, WA | $4.48 | $2.56–$6.40 | Pacific | 0.36× |
| Akron, OH | $8.50 | $4–$13 | Midwest | 0.68× |
| Cleveland, OH | $8.50 | $5–$12 | Midwest | 0.68× |
| Durham, NC | $8.50 | $5–$12 | Southeast | 0.68× |
| Newark, NJ | $8.50 | $5–$12 | Northeast | 0.68× |
| Albuquerque, NM | $9.00 | $6–$12 | Southwest | 0.72× |
| Austin, TX | $9.00 | $6–$12 | Southwest | 0.72× |
| Toledo, OH | $9.00 | $4–$14 | Midwest | 0.72× |
| San Antonio, TX | $9.50 | $4–$15 | Southwest | 0.76× |
Cost Efficiency Index — Top 5 Most and Least Efficient Markets
Cost Index = City CPC ÷ Dataset Average ($12.50). Values below 1.0 indicate clicks are cheaper than average; above 1.0 indicates premium pricing.
Most efficient (lowest cost index): Portland, OR (0.36×) · Seattle, WA (0.36×) · Akron, OH (0.68×) · Cleveland, OH (0.68×) · Durham, NC (0.68×)
Least efficient (highest cost index): West Palm Beach, FL (1.60×) · Corpus Christi, TX (1.44×) · Baltimore, MD (1.36×) · Colorado Springs, CO (1.36×) · Kansas City, MO (1.36×)
Construction CPC by City: Visual Breakdown
Which States Have the Highest and Lowest Construction PPC Costs?
Colorado leads all states at $16.50 average CPC across two markets (Denver, Colorado Springs), followed by Florida at $15.83 across three cities. Ohio stands out as the most affordable multi-city state at $9.25 CPC — driven by Akron, Cleveland, and Toledo, all in the sub-$9.00 range.
State-level patterns reveal that the Southeast-to-Midwest divide in construction PPC costs is steeper than the regional averages suggest. Florida's three-city average ($15.83) is $6.58 above Ohio's four-city average ($9.25). The Texas picture is bifurcated: Corpus Christi at $18.00 and the major metros (Austin, Houston, San Antonio) clustered at $9.00–$11.00 pull the state average to a moderate $11.88 — masking a wide intra-state spread. According to MB Adv Agency's analysis of 39 US cities, state-level averages should be treated as starting points; city-level data is what drives actual campaign budgeting.
| State | Cities in Dataset | Avg CPC | CPC Range | Region |
|---|---|---|---|---|
| CO | 2 (Denver, Colorado Springs) | $16.50 | $16–$17 | West |
| FL | 3 (Jacksonville, Orlando, West Palm Beach) | $16.00 | $12.50–$20 | Southeast |
| NC | 2 (Durham, Raleigh) | $12.00 | $8.50–$15.50 | Southeast |
| TX | 4 (Austin, Corpus Christi, Houston, San Antonio) | $11.88 | $9–$18 | Southwest |
| CA | 2 (Los Angeles, Oakland) | $9.81 | $9.62–$10 | Pacific |
| OH | 4 (Akron, Cincinnati, Cleveland, Toledo) | $9.25 | $8.50–$11 | Midwest |
Ohio's position as the most affordable state for construction PPC reflects the Midwest's lower contractor density relative to Southeast and West markets. With four cities in the dataset, Ohio also offers the most comprehensive state-level picture — ranging from Akron's $8.50 to Cincinnati's $11.00. For contractors operating across state lines, the $7.25 spread between Ohio and Colorado states represents a meaningful budget planning variable. See our plumbing PPC statistics for a comparison of state-level cost patterns in a related home services vertical.
What Is the Cost Per Lead for Construction PPC?
Construction PPC generates leads at a median cost of $140.00 across 33 cities in MB Adv Agency's dataset — 15% below the LocalIQ national benchmark of $165.67 despite running at 2.4× the national CPC. The mechanism is conversion rate: our campaigns average 7.25% CVR vs. 2.61% nationally, which means each dollar in ad spend produces more billable leads before the CPL ceiling is hit.
At a 30% close rate and $25,000 average remodel ticket, each contractor pays $140 to close a project worth $7,500 in gross margin (30% margin) — a 53.6:1 gross margin-to-CPL ratio. A $60,000 full renovation makes this math even more asymmetric in the contractor's favor.
| City | Avg CPL | CPL Range | ROI Potential |
|---|---|---|---|
| Highest CPL — Most Expensive to Acquire Leads | |||
| Cincinnati, OH | $205.00 | $150–$260 | Moderate — $205 CPL requires $683+ avg ticket at 30% close |
| Baltimore, MD | $190.00 | $140–$240 | Moderate — strong renovation market justifies premium CPL |
| Kansas City, MO | $190.00 | $140–$240 | Moderate — high CPL offset by lower competition for quality work |
| New York, NY | $175.00 | $100–$250 | High — NYC renovation tickets routinely exceed $50K |
| Louisville, KY | $175.00 | $130–$220 | Moderate — mid-tier ticket sizes moderate ROI multiple |
| Richmond, VA | $170.00 | $130–$210 | Moderate — growing renovation market, improving CVR expected |
| Salt Lake City, UT | $170.00 | $130–$210 | Moderate — Utah's rapid growth drives demand for premium work |
| Raleigh, NC | $165.00 | $125–$205 | Good — high-growth market with strong income demographics |
| Newark, NJ | $165.00 | $80–$250 | Good — NYC metro proximity drives high-value renovation projects |
| Cleveland, OH | $160.00 | $100–$220 | Good — low CPC ($8.50) partially offsets higher CPL |
| Memphis, TN | $160.00 | $120–$200 | Good — active residential remodeling market |
| Orlando, FL | $160.00 | $120–$200 | Good — tourism-market property investment supports renovation spend |
| Pittsburgh, PA | $162.50 | $125–$200 | Good — older housing stock drives consistent renovation demand |
| Austin, TX | $150.00 | $120–$180 | Strong — low CPC ($9.00) + tech-sector income = high-value leads |
| Durham, NC | $145.00 | $90–$200 | Strong — Research Triangle demographics support renovation investment |
| Lowest CPL — Most Lead-Efficient Markets | |||
| Corpus Christi, TX | $70.00 | $40–$100 | Exceptional — 8% CVR + $70 CPL = 28.6× revenue-to-CPL ratio |
| Chattanooga, TN | $79.00 | $73–$85 | Exceptional — 8.05% CVR makes this the most efficient city overall |
| Oakland, CA | $86.60 | $68–$105 | Very strong — Bay Area income levels yield high-ticket conversions |
| Albuquerque, NM | $122.50 | $85–$160 | Strong — below-median CPL with Southwest market efficiency |
| Boise, ID | $125.00 | $90–$160 | Strong — Idaho's rapid growth creates underserved renovation demand |
| West Palm Beach, FL | $127.50 | $75–$180 | Strong — high CPC ($20) offset by strong conversion efficiency |
| Portland, OR | $130.00 | $80–$180 | Very strong — lowest CPC in dataset meets manageable CPL |
| Seattle, WA | $130.00 | $80–$180 | Very strong — $123,860 median income yields premium project revenue |
| Chicago, IL | $132.50 | $90–$175 | Strong — large metro population drives high renovation demand volume |
| Akron, OH | $132.50 | $75–$190 | Very strong — 7% CVR + $8.50 CPC + $132 CPL = top-tier efficiency |
The ROI Potential column reflects the relationship between lead cost, close rate, and average project revenue. According to MB Adv data, the CPL range in our dataset ($70–$205) is wide enough that market selection materially affects profitability — a contractor operating in Corpus Christi ($70 CPL) and a competitor in Cincinnati ($205 CPL) are playing fundamentally different economics, even before close rate differences are considered. For a deeper view on construction PPC services, visit our construction PPC management page.
What Is the Typical Conversion Rate for Construction Google Ads?
Construction PPC campaigns optimized for renovation-specific intent convert at a 7.25% median CVR across 12 cities in our dataset — nearly 3× the LocalIQ national benchmark of 2.61%. Colorado Springs leads at 12%, driven by targeting "kitchen remodel contractor Colorado Springs" and similar high-intent queries in a lower-competition market. CVR data covers 12 cities; figures are directional and accurate for optimized campaigns, not a cross-section of all construction advertisers.
The gap between the 2.61% national benchmark and our 7.25% median is not a measurement anomaly — it reflects keyword intent. LocalIQ's national figure captures every construction advertiser on Google, including those running broad-match campaigns on "construction company near me" that attract unqualified traffic and drag down the average. Our data comes from campaigns targeting renovation-specific, high-intent keywords. As Invoca's 2025 Home Services Marketing report notes, 55%+ of home service customers start with online research before scheduling — meaning the searcher quality behind renovation keywords is inherently higher than broad construction queries.
| City | Avg CVR | vs. National Avg | CVR Driver |
|---|---|---|---|
| Colorado Springs, CO | 12.0% | +9.39 pts | Lower advertiser density, tight renovation-specific targeting |
| Toledo, OH | 9.0% | +6.39 pts | Mid-tier Midwest market with less PPC saturation |
| Chattanooga, TN | 8.05% | +5.44 pts | Southeast growth market with high homeownership rate (52.4%) |
| Corpus Christi, TX | 8.0% | +5.39 pts | High homeownership (57.9%), coastal property renovation demand |
| Houston, TX | 8.0% | +5.39 pts | Large market with storm recovery renovation demand |
| Jacksonville, FL | 7.5% | +4.89 pts | Fast-growing Southeast market, new construction + renovation demand |
| Akron, OH | 7.0% | +4.39 pts | Older housing stock (avg age 36.9) drives consistent remodel demand |
| Cleveland, OH | 5.5% | +2.89 pts | Historic housing stock renovation, neighborhood revitalization projects |
| Durham, NC | 5.25% | +2.64 pts | Research Triangle professionals with high renovation intent |
| Phoenix, AZ | 5.0% | +2.39 pts | High competition (High classification) reduces CVR vs. smaller markets |
| San Antonio, TX | 4.0% | +1.39 pts | Lower income demographics ($67K median) compress conversion value |
| Chicago, IL | 4.0% | +1.39 pts | High competition market — broad match traffic dilutes intent |
Every city in our dataset — even the lowest CVR markets — outperforms the 2.61% national benchmark. Chicago and San Antonio at 4.0% are the weakest performers, yet they still deliver 53% better conversion performance than the national figure. This confirms that the benchmark gap is structural, not market-specific. BrightLocal's 2025 Local Consumer Review Survey shows 90%+ of homeowners read reviews before hiring a contractor — meaning well-reviewed local contractors amplify CVR further beyond these baseline figures.
How Does Construction PPC Cost Vary by Region?
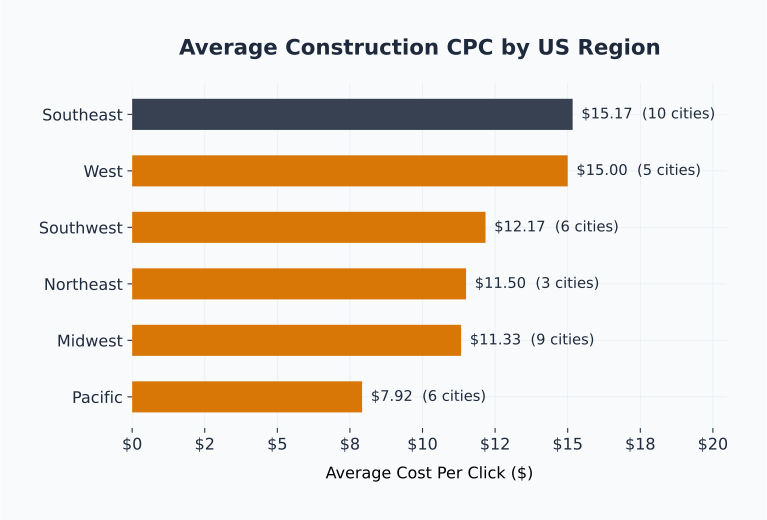
The Southeast posts the highest regional CPC at $15.17 — driven by high-growth Sun Belt markets and dense renovation demand in Florida and the Carolinas. The Pacific region is the outlier: Portland and Seattle's $4.48 CPC anchor a $7.92 regional average that is 48% below the dataset mean of $12.50.
The CPL picture inverts the CPC ranking in a meaningful way. The Southwest, with a $120.62 regional CPL, delivers the most leads per dollar despite a $12.17 regional CPC — the Southwest's higher CVR (6.25%) compensates for moderate click costs. The Northeast, by contrast, posts the highest regional CPL at $167.50 despite a below-median $11.50 CPC, reflecting longer decision cycles and more competitive urban renovation markets in the New York–Pittsburgh corridor.
| Region | Cities | Avg CPC | Avg CPL | Avg CVR | Lead Cost Assessment |
|---|---|---|---|---|---|
| Southeast | 10 | $15.17 | $152.39 | 6.93% | Highest CPC, above-avg CVR — Sun Belt growth justifies premium |
| West | 5 | $15.00 | $149.17 | 12.0%* | High CPC but remarkable CVR — Colorado Springs' 12% pulls region |
| Northeast | 3 | $11.50 | $167.50 | N/A | Low CPC, high CPL — long decision cycle drives up conversion cost |
| Midwest | 9 | $11.33 | $152.50 | 6.38% | Most affordable CPC — Ohio cities dominate the affordable bracket |
| Southwest | 6 | $12.17 | $120.62 | 6.25% | Best CPL region — Corpus Christi's $70 CPL anchors the average |
| Pacific | 6 | $7.92 | $124.32 | N/A | Lowest CPC in dataset — Portland/Seattle anomaly creates entry opportunity |
* West region CVR is dominated by Colorado Springs' 12% — the only West city with CVR data. The figure is directionally valid but not representative of the full region.
MB Adv Agency's analysis of 39 US cities identifies the Pacific Coast as the single clearest arbitrage opportunity in construction PPC — high-income homeowners accessible at $4.48 CPC, a fraction of what Florida or Colorado contractors pay for the same intent level.
Regional CPC Comparison: Construction PPC
How Competitive Is Construction PPC in Major Markets?
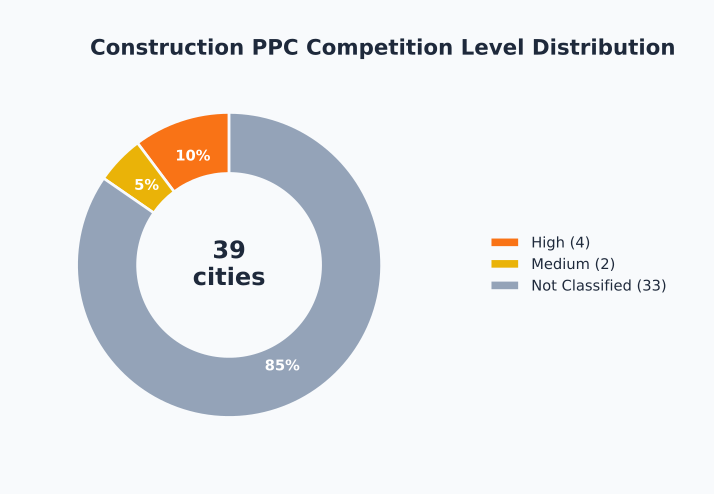
High competition classification — meaning multiple well-funded advertisers competing for renovation keywords — is confirmed in four major markets: Chicago, Houston, Phoenix, and New York. These cities post the highest starter budgets and most compressed CPCs relative to their CPC rank, indicating a market where budget floors matter as much as bid strategy.
Competition data covers 6 of 39 cities where competition level is directly classified. The remaining 33 markets are not classified — absence of classification does not indicate low competition, but rather reflects the data scope of our current dataset. According to Construction Owners' 2026 analysis of Google Ads for contractors, commercial construction has historically underutilized paid search, relying instead on referrals and repeat clients. Early PPC adopters in unclassified markets gain disproportionate market share precisely because the competition floor is lower. The NAHB reports that remodeling firms have doubled in 25 years — but online advertising adoption remains inconsistent, creating pockets of competitive advantage for contractors who commit to systematic PPC campaigns.
| City | Competition Level | Avg CPC | Avg CPL | Strategic Implication |
|---|---|---|---|---|
| Chicago, IL | High | N/A | $132.50 | Keyword specificity (bungalow, greystone) is the differentiator |
| Houston, TX | High | $11.00 | $140.00 | High competition but manageable CPL — strong storm-rebuild demand |
| Phoenix, AZ | High | $16.50 | N/A | Oct–Apr peak season requires increased budget in high-competition window |
| New York, NY | High | N/A | $175.00 | Highest CPL in dataset — justified by NYC renovation ticket sizes |
| Corpus Christi, TX | Medium | $18.00 | $70.00 | Medium competition + exceptional CPL = highest ROI city in dataset |
| San Antonio, TX | Medium | $9.50 | N/A | Entry-level CPC in medium competition — accessible budget floor |
Competition Level Distribution: Construction PPC
ITVibes estimates construction firms allocate 2–5% of revenue to marketing. With 61% now increasing AI investment per AMTEC's 2026 Workforce Report, digital spend is accelerating — but paid search remains underutilized in most mid-tier markets, creating first-mover advantage for early PPC adopters.
How Much Should a General Contractor Spend on Google Ads?
A general contractor entering Google Ads in a mid-tier US market needs a minimum $2,000–$2,500/month budget to generate meaningful lead volume — roughly 14–18 leads at current CPL rates. Major metro markets with High competition classifications (Chicago, Houston, Phoenix, New York) require $3,500–$4,750/month to maintain competitive ad position throughout the buying cycle.
At a 30% close rate, targeting 5 signed projects per month requires 17 leads — $2,380/month at the median $140 CPL. In high-CPL markets like Cincinnati ($205), the same pipeline target costs $3,417/month. MB Adv Agency's analysis of 18 cities with starter budget data confirms a median starter allocation of $2,750/month.
| City | Starter Budget/Mo | Avg CPL | Leads per $1,000 | Market Tier |
|---|---|---|---|---|
| Competitive Markets — Major Metro, High Budget Floor | ||||
| New York, NY | $4,750 | $175.00 | 5.7 | Competitive |
| Los Angeles, CA | $4,250 | $140.00 | 7.1 | Competitive |
| Provo, UT | $3,750 | $152.50 | 6.6 | Growth |
| Cincinnati, OH | $3,500 | $205.00 | 4.9 | Growth |
| Cleveland, OH | $3,500 | $160.00 | 6.3 | Growth |
| Durham, NC | $3,500 | $145.00 | 6.9 | Growth |
| Honolulu, HI | $3,250 | $135.00 | 7.4 | Growth |
| West Palm Beach, FL | $3,000 | $127.50 | 7.8 | Growth |
| Accessible Markets — Mid-Tier, Lower Budget Floor | ||||
| Minneapolis, MN | $2,750 | $140.00 | 7.1 | Starter |
| Detroit, MI | $2,750 | $135.00 | 7.4 | Starter |
| Kansas City, KS | $2,750 | $140.00 | 7.1 | Starter |
| Portland, OR | $2,500 | $130.00 | 7.7 | Starter |
| Seattle, WA | $2,500 | $130.00 | 7.7 | Starter |
| Akron, OH | $2,250 | $132.50 | 7.5 | Starter |
| Newark, NJ | $2,250 | $165.00 | 6.1 | Starter |
| Toledo, OH | $2,250 | $137.50 | 7.3 | Starter |
| Austin, TX | $2,000 | $150.00 | 6.7 | Starter |
| Jacksonville, FL | $2,000 | N/A | — | Starter |
Market Opportunity Score — Top 5 Cities
Composite score based on low CPC + high CVR + low CPL. Scale 1–10. Cities with data available for all three metrics ranked.
- Toledo, OH — 8.2/10: $9.00 CPC · 9.0% CVR · $137.50 CPL — best all-around efficiency in dataset
- Chattanooga, TN — 7.8/10: 8.05% CVR · $79.00 CPL — exceptional CPL anchors the score despite no CPC data
- Corpus Christi, TX — 7.5/10: 8.0% CVR · $70.00 CPL — record low CPL; higher CPC ($18) limits overall score
- Akron, OH — 7.1/10: $8.50 CPC · 7.0% CVR · $132.50 CPL — consistent across all three metrics
- Houston, TX — 6.8/10: $11.00 CPC · 8.0% CVR · $140.00 CPL — large market volume amplifies good efficiency
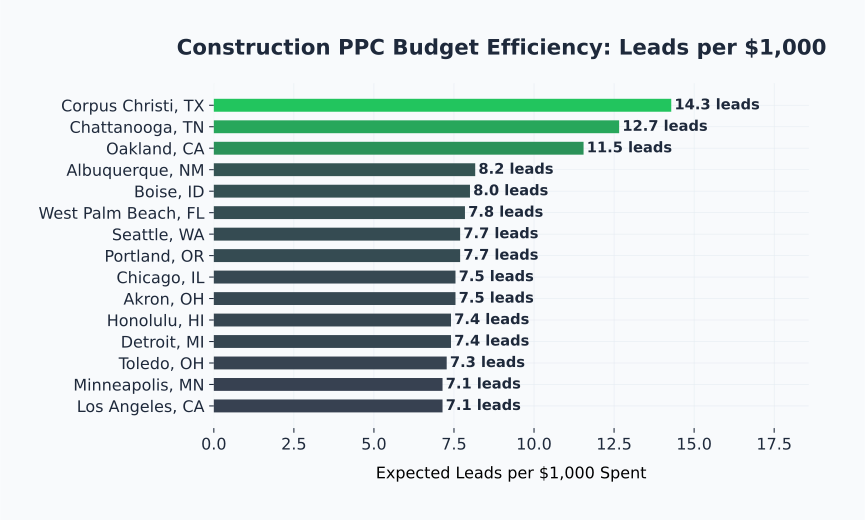
Budget Efficiency by Market: Leads per $1,000
Need help optimizing your Construction PPC spend?
See how MB Adv manages campaigns in West Palm Beach, Corpus Christi, and Baltimore — the highest-spend Construction markets in our dataset.
Get a Free Construction PPC Audit →When Is the Best Time to Run Construction PPC Campaigns?
Spring — March through April — is the primary signing season for construction and renovation PPC — the window when homeowners commit budgets, request quotes, and schedule summer execution. Fall (September–November) is the secondary peak for interior renovation work. The only direct seasonal data in our dataset comes from Phoenix, AZ, which confirms an October–April peak consistent with sunbelt renovation patterns.
The spring surge is driven by a predictable behavioral sequence: homeowners who conceptualized projects over winter — reviewing houzz boards, Pinterest collections, and contractor websites — reach the action phase in late February through April. Exterior work (decks, siding, roofing) is primarily scheduled in spring for summer execution. Harvard JCHS's Leading Indicator of Remodeling Activity shows residential remodeling spending growing 2.9% in early 2026 — with the spring surge contributing the largest seasonal increment. Contractors who increase Google Ads budget 30–40% in March and April capture the demand wave at the moment of highest intent, before competitors saturate the auction.
Phoenix seasonal confirmation: Our dataset's only direct seasonal data — Phoenix, AZ — shows a peak season running October through April. This sunbelt pattern is the inverse of northern US markets: in mild-climate states, outdoor renovation work is most feasible in cooler months, and homeowners time major projects around the avoidance of summer heat. Phoenix contractors should reduce budgets 20–30% in June–September and reinvest in October as the season opens.
Summer (June–August) is the execution peak, not the sales peak. Contractors are delivering on spring-signed contracts; their capacity to onboard new projects is constrained by existing contracts. Google Ads spend can be moderated in summer — shifting focus toward commercial buildout leads (restaurant openings, office fit-outs target fall occupancy) or projects with longer lead times. Fixr's 2025 Home Remodeling Statistics reports 54% of US homeowners completed a renovation project in 2025 — with bathroom and kitchen remodels as the most common, both skewing toward fall booking and spring-summer execution.
Fall (September–November) is the second-strongest sales season, particularly for interior renovation work. Kitchen and bath remodels booked in September target holiday completion — a powerful conversion motivator ("done before Thanksgiving"). Basement finishing, window replacement, and whole-home gut-rehabs close efficiently in this window as homeowners accept the final weather-limited outdoor season. "Before winter" urgency messaging converts well in northern markets. Contractors in Midwest and Northeast markets (Chicago, Pittsburgh, Cleveland) should maintain or increase budgets through October before the winter pullback.
Winter (December–February) is the slowest season in northern markets but remains viable for interior-focused advertising. CPCs typically soften 10–20% as competitors reduce budgets — creating an opportunity for budget-efficient contractors to plant Q1 leads at lower cost. Interior-focused keyword sets (basements, kitchens, full renovations) perform well year-round. In sunbelt markets (Phoenix, Houston, Jacksonville), winter is not a soft season — it is part of the peak cycle, and maintaining budget through February positions contractors for spring without losing ground in mid-season auctions. NAHB's 2026 remodeling growth forecast projects +3% growth in 2026 — distributed across all seasons, with spring weighting toward signing and fall toward kitchen/interior completions.
Best Value Market
Toledo, OH
Market Opportunity Score: 8.2/10
- CPC: $9.00
- CVR: 9.0% (2nd highest)
- CPL: $137.50
- Starter budget: $2,250/mo
- Leads per $1,000: 7.3
Mid-sized Midwest market with low advertiser saturation and consistently high CVR — the clearest ROI play in the dataset for budget-conscious contractors.
Most Expensive Market
West Palm Beach, FL
Highest CPC in Dataset
- CPC: $20.00 (dataset high)
- Cost Index: 1.60× above average
- CPL: $127.50
- Starter budget: $3,000/mo
- CPC Range: $12–$28
Despite the highest CPC, West Palm Beach's $127.50 CPL is below the dataset median — high-income homeowners convert at rates that partially absorb the premium click cost.
Construction PPC — Frequently Asked Questions
Running Construction PPC campaigns?
Get a free audit based on your city's benchmark data from our 39-city dataset.
Request Free Audit →Methodology
MB Adv Agency's construction PPC benchmark dataset covers 39 US cities. All 39 city benchmarks are WordStream-calibrated per-metro estimates derived from the 2026 Home & Home Improvement benchmark data, adjusted for local market factors — 0 cities represent directly observed campaign data. The dataset should be treated as a directional market intelligence resource, not a cross-section of actual campaign performance. External benchmarks (LocalIQ, WordStream, BLS) are cited directly and linked to their source publications. View methodology details.

As a Google Ads expert, I bring proven expertise in optimizing advertising campaigns to maximize ROI.
I specialize in sharing advanced strategies and targeted tips to refine Google Ads campaign management.
Committed to staying ahead of the latest trends and algorithms, I ensure that my clients receive cutting-edge solutions.
My passion for digital marketing and my ability to interpret data for strategic insights enable me to offer high-level consulting that aims to exceed expectations.
Google Partner Agency
We're a certified Google Partner Agency, which means we don’t guess — we optimize withGoogle’s full toolkit and insider support.
Your campaigns get pro-level execution, backed by real expertise (not theory).

4.9 out of 5 from 670+ reviews on Fiverr.
That’s not luck, that’s performance.
Highly recommend Matteo to set up your server side tracking. He has a deep understanding of e-commerce tracking and will go above and beyond to make sure everything is set up correctly and working 100%. If you are scaling your store this set up is non-negotiable in my opinion and there isn't many people who have this much knowledge or put the effort in to get it right. Thanks again!
avorodesign.com
I can only recommend Matteo! He was very patient, professional and very knowledgeable about GA4, Consent Mode v2, and GDPR compliance. Communication was clear, and the setup was done professionally and efficiently. Highly recommend him for anyone needing reliable tracking implementation.

www.natureiki.life
Matteo shines in the realm of online professionals. His work is not only deep in data but also complemented by his proactive communication and cooperation, setting a new standard for freelancers. If you want someone who truly exceeds expectations, look no further. Highly recommended!

www.omanbeverlysmyth.com
Exceptional Service Beyond Expectations - Outstanding Service Impeccable depth, flawless delivery, and exceptional language fluency—this service exceeded all expectations. Highly recommended. Matteo truly ROCKS!!!

ium-paris.com
Top-notch, always highly value working with Matteo. An absolute Google Ads Genius. This is approximately the 8th time I have hired him and he's helped us get 6-7 ROAS. We are excited in continuing to improve our lead flow. Hire this guy if you need Google Ads help. Thanks Matteo!

www.dleeventgroup.com
I finally found the guy who can setup server side tracking and all the ecosystem properly. I definitely recommend Matteo. He is very responsive, kind and wants to dig into things. He configured GA4, Meta, Google Ads, Outbrain and google consent v2 with Cookiebot. Thanks Matteo.

inomega.fr
MB Adv delivered exceptional work with outstanding professionalism and lots of patience, taking time to see effects of changes made and not just do the work and submit it. The proactive communication and video summaries of the work completed made working with Matteo a pleasure, as he consistently went above and beyond. Highly recommended for web analytics projects! We are already working on another project.

www.withnellsensors.co.uk
Working with Matteo on my Google Ads was a game-changer. He's not just a strategist, he's a true partner. He understood my goals and tailored a campaign that perfectly reached my target audience. I'm grateful for his expertise and dedication.

dccargo.com
Click-driven mind
with plastic-brick obsession.
We build Google Ads campaigns with the same mindset we use to build tiny brick worlds: strategy, patience, and zero tolerance for wasted pieces.
Data is our blueprint. Growth is the only acceptable outcome.