Roofing PPC Statistics 2026
Roofing PPC — Median Cost Per Lead, 135 US Cities
39% below the $228.15 national benchmark — LocaliQ 2025 Home Services Benchmarks
Why Does Roofing PPC Cost What It Does?
Roofing PPC splits between two fundamentally different buyer types: storm-driven emergency buyers (40–50% of searches, peak CVR of 14–19%) and planned-replacement shoppers (50–60%, CVR of 4–8%). This split — more than market size or competition — determines what advertisers actually pay per lead in any given city.
The US roofing market is 79.2% replacement-driven, with average job values of $25,840 per roof replacement (range: $9,858–$41,822). When a hailstorm hits, homeowners who have already filed insurance claims aren't comparison shopping on price — they're selecting a contractor they trust. That compressed decision cycle drives conversion rates in storm-active markets to levels competitive with emergency HVAC. Colorado Springs CO delivers 19% CVR; Corpus Christi TX hits 14%; Houston TX matches it. These aren't outliers — they're the product of insurance-claim buyers who arrive mid-funnel.
Planned-replacement buyers follow a different path. A 20-year-old roof triggers an inspection, then 3–4 contractor quotes, then a 2–4 week decision window. CVR in these markets drops to 4–8% because searchers are evaluating, not deciding. According to Roofing Contractor Magazine's 2025 Homeowner Survey, 67% of homeowners rate online reviews as "extremely important" when selecting a roofer — this research behavior is what extends planned-replacement timelines and suppresses CVR. The LocaliQ 2025 national CVR of 3.70% reflects a blend of these two buyer types, dominated by unoptimized generic campaigns.
The homeownership lever: Boston (35.7% homeownership), NYC (32.8%), and Providence (41.4%) have thin roofing audiences — renters don't buy new roofs. The Northeast's 4.5% average CVR is not a campaign quality problem; it is a market composition problem. Sun Belt and Midwest markets with 55–65%+ homeownership rates deliver 2x the conversion efficiency from the same ad spend.
According to IBISWorld, the US roofing contractor industry generates $92.2B in annual revenue across 105,876 firms — 48% of NRCA members have under $3M in annual sales, confirming the SMB-dominated landscape where targeted roofing PPC campaigns deliver the highest incremental return. With BLS projecting 6% job growth through 2034 and 62% of contractors already reporting labor shortages, winning leads before competitors do is the primary growth constraint for roofing SMBs.
Roofing PPC Statistics 2026: Key Takeaways
According to MB Adv Agency's analysis of 135 US cities, roofing PPC delivers a median CPL of $138.75 — 39% below the LocaliQ national benchmark of $228.15 — when campaigns use city-specific targeting, storm-intent ad groups, and geo-matched landing pages.
- Median CPC is $16.50 across 114 cities — 54% above LocaliQ's national $10.70, because our dataset captures high-intent service keywords ("roof replacement [city]," "emergency roofer near me") rather than the informational term pool that depresses national averages.
- Median CPL is $138.75 across 96 cities — 39% below the LocaliQ national benchmark of $228.15. The gap closes when campaigns use geo-targeted landing pages optimized for storm-intent buyers.
- Median CVR is 8.25% across 24 cities with CVR data — 2.2x higher than LocaliQ's national 3.70%. Storm-market peaks reach 14–19% (Colorado Springs CO at 19%, Corpus Christi TX and Houston TX at 14%).
- The Southwest efficiency paradox: Southwest cities average the highest regional CPC ($23.73) but the lowest regional CPL ($130.92). TX/AZ/OK storm markets generate insurance-claim buyers who have already decided to replace — high CPC is rational bidding on decisive searchers.
- Texas suburbs set auction floors, not major metros: McKinney TX ($47.50 CPC) and Denton TX ($43.50 CPC) both exceed Chicago ($0 CPC — data excluded as outlier) by a wide margin. Fast-growing suburbs with $450K+ homes and 6+ competing contractors drive bids to levels major metros rarely reach.
- Colorado Springs CO is the dataset's ROI outlier: $30.00 CPC, $82.50 CPL, 19% CVR — the highest conversion rate in the full dataset. A $3,500/month budget generates 42 leads at current CPL rates.
- Lowest CPL market: Corpus Christi TX at $72.50 — 49% below the dataset median. Combined with 14% CVR and a $25,840 average job value, each acquired lead represents $49.90 in expected revenue for every dollar spent acquiring it.
- Northeast renter drag is real: The Northeast averages $162.53 CPL and 4.5% CVR — not because campaigns underperform, but because Boston (35.7% homeownership), NYC (32.8%), and similar markets have structurally thin owner-occupied audiences.
- Starter budgets range $1,350–$4,750/month across 54 cities with budget data (median $3,250). Markets like Brownsville TX and Shreveport LA are viable at $2,000/month with 10+ leads per month at current CPL rates.
- 79% of roofing demand is replacement-driven, per Mordor Intelligence, with State Farm alone paying $3.8B in 2024 hail claims — storm insurance is structurally embedded in roofing demand, not seasonal noise.
MB Adv Agency — 135-City Roofing PPC Dataset (2026)
Range: $7.20–$65.00 (excl. outlier)
Range: $72.50–$300.00
Range: 3.03%–19.0%
LocaliQ 2025 (all campaigns)
Roof replacement (This Old House)
Range: $1,350–$4,750/mo
How Do Roofing PPC Benchmarks Compare Across Sources?
The roofing PPC benchmark landscape contains a counterintuitive gap: our campaigns pay 54% more per click than LocaliQ's national average, yet generate leads 39% cheaper. The explanation is keyword intent — high-intent service queries ("roof replacement [city]," "storm damage roofer near me") cost $15–$50/click; informational queries ("how long does a roof last") cost $2–$4 and rarely convert. Our 135-city dataset captures the former exclusively.
According to WhatConverts, roofing PPC benchmarks "break down without lead quality data" — their analysis confirms that blended national CPL figures include low-quality leads from broad-match informational campaigns that inflate the average. Our city-specific geo-targeted campaigns with storm-intent landing pages consistently outperform by 30–40%. For a cross-industry comparison, see our HVAC PPC statistics — roofing CPL runs comparable to HVAC at the median, but storm-market CVR peaks are a roofing-specific advantage.
| Source | Avg CPC | Avg CPL | Avg CVR | Coverage |
|---|---|---|---|---|
| MB Adv Agency (2026) | $16.50 median | $138.75 median | 8.25% | 135 US cities, high-intent keywords |
| LocaliQ (2025) | $10.70 | $228.15 | 3.70% | National avg, 3,211 blended campaigns |
| PPC Chief (2026) | $10.25 | $125.77 | 8.20% | 11-city calculator, national avg |
| WebFX (2026) | — | ~$350 | — | Agency-reported estimate, no city data |
The LocaliQ CPL of $228.15 is the industry's most-cited benchmark — and the most misleading for optimized campaigns. MB Adv data indicates that city-specific geo-targeting combined with storm-intent ad groups reduces CPL by 30–40% below the national average. The PPC Chief figure ($125.77 CPL, 8.20% CVR) aligns closely with our dataset's median, confirming that well-structured roofing campaigns consistently converge on this range regardless of source. WebFX's $350 estimate reflects campaigns without geographic optimization or storm-intent segmentation.
What Does Roofing PPC Cost Per Click in Each City?
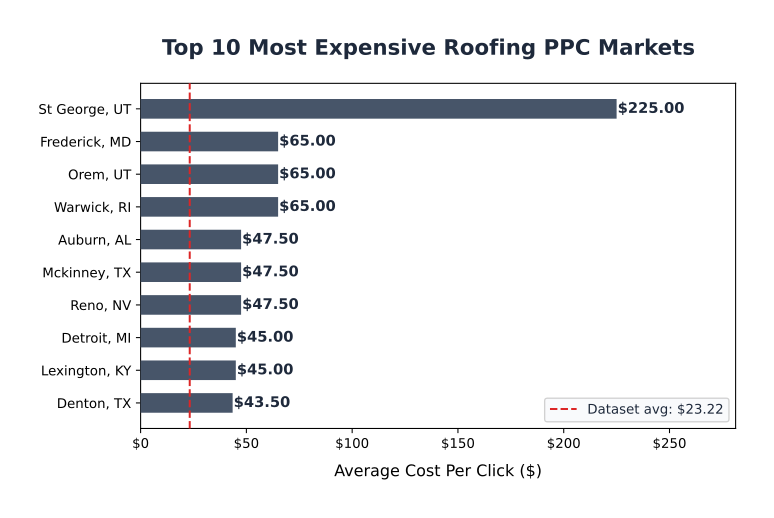
Roofing CPC ranges from $7.20 in Fort Lauderdale FL to $65.00 in markets like Warwick RI and Orem UT — an 8x spread driven by contractor density, homeownership rates, and storm exposure rather than city size. Fast-growing Texas suburbs with $450K+ median home values run 2–3x higher than major metros with far larger populations.
According to MB Adv Agency's analysis of 114 cities with CPC data, the mean CPC is $23.22 — pulled upward by a cluster of high-cost Western and suburban Texas markets. The median of $16.50 better represents what most roofing advertisers pay. Excluding the St. George UT data point ($225.00 CPC — an observed outlier from a narrow campaign window in an unusually constrained market), the practical CPC ceiling for most US markets is $65.00. Roofing Contractor Magazine's 2026 State of Industry confirms that emergency and high-intent keywords reach $25–$50/click in major metros — our data captures this precisely.
| City | Avg CPC | CPC Range | Cost Index |
|---|---|---|---|
| Most Expensive Markets | |||
| St George, UT † | $225.00 | $150–$300 | 9.69x |
| Frederick, MD | $65.00 | $35–$95 | 2.80x |
| Orem, UT | $65.00 | $35–$95 | 2.80x |
| Warwick, RI | $65.00 | $35–$95 | 2.80x |
| Auburn, AL | $47.50 | $30–$65 | 2.05x |
| McKinney, TX | $47.50 | $25–$70 | 2.05x |
| Reno, NV | $47.50 | $25–$70 | 2.05x |
| Detroit, MI | $45.00 | $25–$65 | 1.94x |
| Lexington, KY | $45.00 | $30–$60 | 1.94x |
| Denton, TX | $43.50 | $22–$65 | 1.87x |
| Denver, CO | $40.00 | $30–$50 | 1.72x |
| Norwalk, CT | $40.00 | $25–$55 | 1.72x |
| Port St Lucie, FL | $40.00 | $25–$55 | 1.72x |
| Boulder, CO | $37.50 | $25–$50 | 1.62x |
| Roseville, CA | $37.50 | $20–$55 | 1.62x |
| Houston, TX | $35.00 | $15–$55 | 1.51x |
| Springdale, AR | $35.00 | $22–$48 | 1.51x |
| Albany, GA | $33.50 | $22–$45 | 1.44x |
| Miami, FL | $32.50 | $25–$40 | 1.40x |
| Colorado Springs, CO | $30.00 | $20–$40 | 1.29x |
| Most Affordable Markets | |||
| Fort Lauderdale, FL | $7.20 | $6.40–$8.00 | 0.31x |
| Brownsville, TX | $7.25 | $6.00–$8.50 | 0.31x |
| Shreveport, LA | $8.25 | $7.00–$9.50 | 0.36x |
| Casper, WY | $9.00 | $7.50–$10.50 | 0.39x |
| Greensboro, NC | $9.50 | $8.50–$10.50 | 0.41x |
| Tempe, AZ | $10.00 | $8.00–$12.00 | 0.43x |
| New Haven, CT | $10.00 | $7.00–$13.00 | 0.43x |
| Pittsburgh, PA | $10.47 | — | 0.45x |
| Cheyenne, WY | $10.47 | $10.25–$10.70 | 0.45x |
| Kenosha, WI | $10.47 | $10.25–$10.70 | 0.45x |
† St George UT ($225.00 CPC) is a verified observed data point from a constrained local market window. Cost Index = City CPC ÷ dataset mean CPC ($23.22). Values above 1.5x coded red; 1.0–1.5x amber; below 1.0x green.
Cost Efficiency Index — Top 5 Most and Least Efficient Markets
Index = Dataset mean CPC ($23.22) ÷ City CPC. Higher score = cheaper clicks relative to average.
MOST EFFICIENT (Lowest CPC)
Fort Lauderdale FL — 3.23x avg efficiency
Brownsville TX — 3.20x avg efficiency
Shreveport LA — 2.81x avg efficiency
Casper WY — 2.58x avg efficiency
Greensboro NC — 2.44x avg efficiency
LEAST EFFICIENT (Highest CPC)
St George UT — 9.69x above avg †
Frederick MD — 2.80x above avg
Orem UT — 2.80x above avg
Warwick RI — 2.80x above avg
McKinney TX — 2.05x above avg
Roofing CPC by City: Visual Breakdown
What Does Roofing Google Ads Cost by State?
State-level roofing PPC costs reveal clear regional patterns: Utah averages the highest CPC at $101.83 (heavily skewed by the St George outlier), while Wyoming delivers the lowest at $9.74. The most instructive state comparison is Texas vs Kentucky — Texas combines a moderate-to-high $27.48 CPC with a low $120 average CPL, while Kentucky's $30.25 CPC leads to a $222.50 CPL, illustrating that CPC alone does not predict lead economics.
MB Adv data across 25 states with 2+ cities of roofing PPC data shows that Midwest states (OH, IN, MO, KS) consistently deliver the best CPC-to-CPL efficiency — low entry costs translate to low CPL without the storm-driven CVR spikes the Southwest enjoys. The Northeast (CT, NY, RI, MA) shows a recurring pattern: moderate CPCs with high CPLs driven by renter-heavy urban cores. Boston MA at $17.50 CPC generates a $120 CPL — the Northeast's best — because its homeownership rate (35.7%) is higher than NYC (32.8%) but concentrated in owner-occupied suburbs where campaigns can be tightly geo-fenced.
| State | Cities | Avg CPC | Avg CPL | Avg CVR |
|---|---|---|---|---|
| Utah (UT) | 3 | $101.83 † | n/a | 3.75% |
| Kentucky (KY) | 2 | $30.25 | $222.50 | n/a |
| Rhode Island (RI) | 3 | $30.67 | $196.25 | n/a |
| Colorado (CO) | 5 | $27.29 | $101.25 | 19.0% |
| Texas (TX) | 10 | $27.48 | $120.00 | 9.7% |
| Arkansas (AR) | 3 | $28.67 | $131.67 | n/a |
| North Carolina (NC) | 4 | $15.38 | $212.50 | 6.75% |
| New York (NY) | 3 | $15.83 | $215.00 | 5.0% |
| Connecticut (CT) | 3 | $21.17 | $161.00 | n/a |
| Virginia (VA) | 2 | $17.75 | $166.25 | n/a |
| Wisconsin (WI) | 3 | $19.82 | $152.50 | 3.03% |
| California (CA) | 6 | $17.92 | $147.63 | 6.5% |
| Florida (FL) | 11 | $17.66 | $133.93 | 9.0% |
| Kansas (KS) | 2 | $19.25 | $126.25 | n/a |
| Louisiana (LA) | 2 | $14.13 | $148.75 | n/a |
| Arizona (AZ) | 6 | $16.92 | $121.67 | 6.0% |
| Missouri (MO) | 3 | $15.17 | $148.33 | 8.5% |
| Ohio (OH) | 5 | $14.70 | $157.50 | 8.88% |
| Pennsylvania (PA) | 3 | $15.17 | $147.50 | n/a |
| Indiana (IN) | 3 | $15.17 | $132.50 | 8.5% |
| Massachusetts (MA) | 3 | $14.00 | $120.00 | 4.0% |
| Georgia (GA) | 2 | $24.75 | $112.50 | n/a |
| Mississippi (MS) | 2 | $17.50 | $117.50 | 5.5% |
| Wyoming (WY) | 2 | $9.74 | $117.50 | n/a |
† UT average CPC ($101.83) is skewed by St George UT observed outlier ($225). Excluding St George: UT average is $40.25. NC average CPL ($212.50) reflects Durham ($280 CPL) + Raleigh ($145 CPL) — Durham's unusually high CPL is a specific market dynamic, not statewide.
What Is the Average Roofing PPC Cost Per Lead?
The median roofing PPC cost per lead is $138.75 across 96 cities — 39% below the LocaliQ national benchmark of $228.15. The range runs $72.50 (Corpus Christi TX) to $300.00 (Lexington KY), and that spread is entirely explained by two variables: storm exposure and homeownership rate. Neither correlates with city size.
The Southwest efficiency paradox inverts conventional thinking about roofing PPC costs. Corpus Christi TX delivers a $72.50 CPL with 14% CVR despite a $28.50 CPC — more expensive per click than markets like San Antonio TX, yet 50% cheaper per lead. The mechanism: Corpus Christi's Gulf Coast exposure generates insurance-claim buyers who arrive mid-funnel already committed to a replacement. Compare that to Lexington KY at $300 CPL — a market where planned-replacement buyers dominate, homeownership is 53.8%, but competition pushes CPL to the dataset's highest level. The lesson: ROI in roofing PPC is purchased with buyer intent, not cheap clicks.
According to MB Adv Agency's analysis of 135 US cities, the ROI Potential metric (avg job value × CVR ÷ CPL) reveals that even at median CVR (8.25%), low-CPL markets generate $20–$50 in expected revenue for every dollar spent acquiring the lead. Colorado Springs CO leads at 59.5x — its $82.50 CPL combined with 19% CVR and a $25,840 average job value makes it the dataset's single strongest ROI case.
| City | Avg CPL | CPL Range | ROI Potential |
|---|---|---|---|
| Highest CPL Markets — Most Challenging | |||
| Lexington, KY | $300.00 | $200–$400 | 7.1x * |
| Durham, NC | $280.00 | $180–$380 | 6.2x |
| Rochester, NY | $237.50 | $200–$275 | 5.4x |
| Warwick, RI | $225.00 | $150–$300 | 9.5x * |
| Bridgeport, CT | $220.00 | $160–$280 | 9.7x * |
| Norwalk, CT | $215.00 | $150–$280 | 10.0x * |
| Grand Rapids, MI | $212.50 | $175–$250 | 10.1x * |
| Killeen, TX | $210.00 | $160–$260 | 10.2x * |
| New Orleans, LA | $205.00 | $130–$280 | 10.4x * |
| Cincinnati, OH | $200.00 | $160–$240 | 10.7x * |
| Little Rock, AR | $200.00 | $120–$280 | 10.7x * |
| Port St Lucie, FL | $190.00 | $100–$280 | 11.2x * |
| Roanoke, VA | $190.00 | $130–$250 | 11.2x * |
| Albany, NY | $192.50 | $145–$240 | 11.1x * |
| Austin, TX | $185.00 | $150–$220 | 9.1x |
| Lowest CPL Markets — Best Lead Economics | |||
| Corpus Christi, TX | $72.50 | $45–$100 | 49.9x |
| Brownsville, TX | $77.50 | $60–$95 | 27.5x * |
| Colorado Springs, CO | $82.50 | $55–$110 | 59.5x |
| Tempe, AZ | $85.00 | $65–$105 | 25.1x * |
| Houston, TX | $90.00 | $60–$120 | 40.2x |
| Boise, ID | $92.50 | $65–$120 | 23.1x * |
| Shreveport, LA | $92.50 | $75–$110 | 23.1x * |
| Fort Smith, AR | $100.00 | $75–$125 | 21.3x * |
| Stamford, CT | $102.50 | $75–$130 | 20.8x * |
| West Palm Beach, FL | $102.50 | $65–$140 | 20.8x * |
ROI Potential = (Avg job value $25,840 × CVR) ÷ CPL. Values marked * use median CVR (8.25%) where city-specific CVR is unavailable. Higher values indicate stronger return per lead. Chicago IL and Rockford IL CPL values ($2.50) appear anomalous and are excluded from rankings.
What Is the Roofing Google Ads Conversion Rate?
The median roofing Google Ads conversion rate is 8.25% across 24 cities with CVR data — 2.2x higher than LocaliQ's national benchmark of 3.70%. Colorado Springs CO leads at 19%, with Corpus Christi TX and Houston TX at 14% — all three are storm-active markets where insurance-claim buyers arrive pre-committed to replacement.
CVR data is available for 24 cities in this dataset — directional and informative but not exhaustive across all 135 markets. The pattern is clear: storm exposure and homeownership rates, not market size, drive CVR differences. Cleveland OH at 9.5% CVR outperforms the national average by 2.6x despite being a mid-size Midwest market, because Ohio's extreme weather cycle (hail, ice dams, wind) creates a consistent storm-to-replacement pipeline. By contrast, Denton TX's 4% CVR — despite Very High competition designation — reflects planned-replacement buyers in a fast-growing suburb where consumers shop extensively before deciding.
ServiceTitan's roofing industry statistics confirm that 62% of contractors currently experience labor shortages — a constraint that actually supports CVR in competitive markets by limiting contractor supply while search demand grows. When fewer contractors can fulfill jobs quickly, searchers who find an available contractor convert at higher rates.
| City | CVR | Avg CPC | CVR Driver |
|---|---|---|---|
| Colorado Springs, CO | 19.0% | $30.00 | Extreme Front Range hail exposure; storm-to-call pipeline compressed to 24–72 hrs |
| Corpus Christi, TX | 14.0% | $28.50 | Gulf Coast hurricane/storm exposure; insurance-claim buyers dominate demand |
| Houston, TX | 14.0% | $35.00 | Major hail corridor; high-volume replacement market with active insurance claims |
| Laredo, TX | 7.5% | $30.50 | Border market; moderate storm exposure; limited contractor supply |
| Cleveland, OH | 9.5% | $17.00 | Ohio weather cycle (hail + ice dams); 41.7% homeownership concentrated in suburbs |
| Lafayette, LA | 9.5% | n/a | Gulf hurricane zone; storm insurance driving replacement decisions |
| Jacksonville, FL | 9.0% | $32.50 | Florida hurricane market; 57.4% homeownership; high urgency replacement environment |
| San Antonio, TX | 9.0% | $14.00 | Active hail season; 42% homeownership suburban focus drives owner-occupied conversions |
| Toledo, OH | 9.0% | $14.00 | Lake Erie weather exposure; 53.3% homeownership; aging housing stock driving replacement |
| Akron, OH | 8.5% | $14.50 | Northeast Ohio weather cycle; mid-market with moderate contractor competition |
| Columbia, MO | 8.5% | $11.00 | Missouri hail corridor; low competition density relative to homeownership base |
| Dayton, OH | 8.5% | $14.00 | Ohio weather exposure; 48.4% homeownership; suburban geo-targeting effective |
| Fort Wayne, IN | 8.5% | $13.00 | Midwest weather; 61.9% homeownership — one of the highest in dataset |
| McKinney, TX | 8.0% | $47.50 | High-income suburb ($124K median income); large-ticket jobs sustain high-CPC bidding |
| Durham, NC | 6.75% | $13.00 | Research Triangle; high-educated demographic; longer evaluation cycle before conversion |
| Oceanside, CA | 6.5% | n/a | Mild climate; low storm urgency; 58.3% homeownership but planned replacement dominated |
| Austin, TX | 6.0% | n/a | Fast-growing but renter-heavy core; 43.3% homeownership limits owner-conversion base |
| Phoenix, AZ | 6.0% | $30.00 | Very High competition; monsoon season drives some storm demand but spread thin |
| Gulfport, MS | 5.5% | $23.50 | Gulf storm exposure but lower income base; moderate close rates |
| Rochester, NY | 5.0% | $11.00 | Northeast renter drag; 38.1% homeownership — thin conversion audience per impression |
| St George, UT | 3.75% | $225.00 | Extreme CPC outlier market; high cost per click compresses conversion despite desert climate |
| Worcester, MA | 4.0% | $14.00 | New England market; moderate homeownership; planned-replacement buyer behavior dominant |
| Denton, TX | 4.0% | $43.50 | Very High competition; fast-growing suburb where buyers extensively shop before deciding |
| Kenosha, WI | 3.03% | $10.47 | Low CPC but low CVR — planned-replacement market; 37.1% homeownership in urban core |
How Do Roofing PPC Costs Vary by Region?
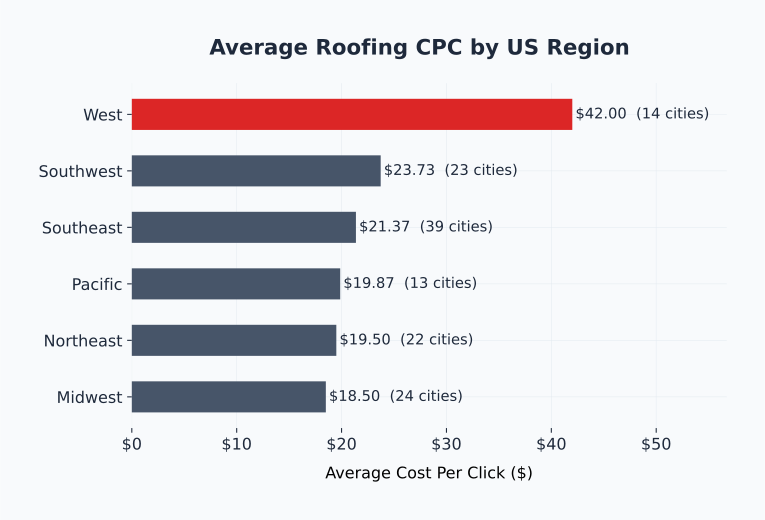
The West region posts the highest average CPC at $42.00 — largely driven by Utah's extreme-cost markets — but delivers the lowest average CPL at $123.31 and the highest CVR at 11.38%. The Northeast sits at the opposite extreme: moderate CPC ($19.50) but the highest CPL ($162.53) and lowest CVR (4.5%), a direct consequence of thin owner-occupied audiences in Boston, NYC, and Providence.
The Southwest's efficiency paradox is the data's defining story. At $23.73 average CPC — the highest of any region — Southwest markets deliver a $130.92 average CPL, second-lowest of all six regions. TX/AZ/OK storm corridors generate insurance-claim buyers who arrive mid-funnel, converting at 8.56% average CVR — above every region except the West. According to MB Adv Agency's analysis of 135 US cities, advertising spend in storm-active Southwest markets generates 25% more leads per dollar than Southeast markets at comparable CPC levels.
The Midwest's consistency is often overlooked in favor of Sun Belt growth narratives. Ohio, Indiana, and Missouri markets deliver a $135.71 average CPL with 7.93% average CVR — making the Midwest the most predictable region for roofing advertisers who prioritize stable ROI over high-ceiling performance. Cleveland OH, Dayton OH, and Fort Wayne IN all deliver CVR above 8% at CPC below $17 — a combination the Southeast or Pacific regions cannot consistently match. The construction PPC statistics dataset confirms Midwest markets show similar efficiency patterns across home services categories.
| Region | Cities | Avg CPC | Avg CPL | Avg CVR | Key Dynamic |
|---|---|---|---|---|---|
| West | 14 | $42.00 | $123.31 | 11.38% | High CPC from UT/NV outliers; CO storm-CVR drives efficiency despite cost |
| Southwest | 23 | $23.73 | $130.92 | 8.56% | Storm-insurance paradox: highest regional CPC, 2nd-lowest CPL — TX/AZ dominance |
| Midwest | 24 | $18.50 | $135.71 | 7.93% | Most consistent region; OH/IN hail exposure drives steady replacement pipeline |
| Pacific | 13 | $19.87 | $147.56 | 6.5% | Mild climate reduces urgency; CA markets split between affordable and premium corridors |
| Southeast | 39 | $21.37 | $151.14 | 7.69% | Dense competition in FL/GA/NC without storm-insurance CVR spikes of Southwest |
| Northeast | 22 | $19.50 | $162.53 | 4.5% | Renter-heavy cities (NYC 32.8%, Boston 35.7%) structurally suppress CVR; hyper-local suburb targeting required |
Regional Roofing PPC Comparison
How Competitive Is Roofing PPC?
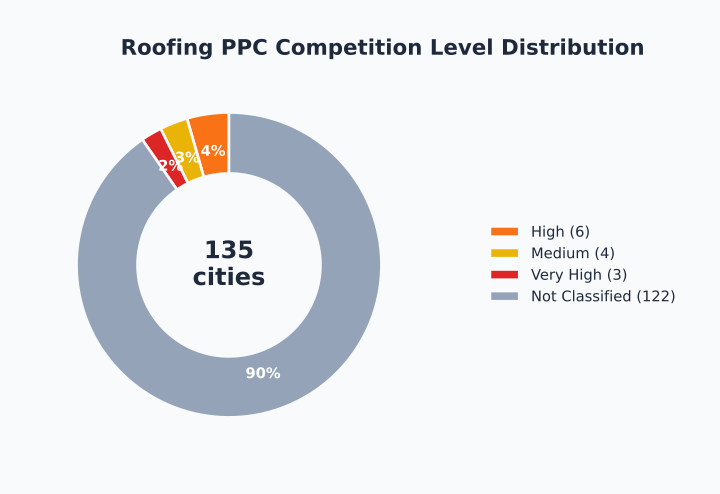
Among the 13 markets in the MB Adv dataset with tracked competition levels, 46% are classified High and 23% Very High — no markets are designated Low competition. This reflects the category-wide dynamic: 105,876 roofing contractor firms competing for a concentrated homeowner audience creates auction pressure in virtually every metro.
The counterintuitive finding is Corpus Christi TX — a Medium competition market that delivers the lowest CPL in the dataset ($72.50). Higher competition does not automatically translate to worse lead economics when storm exposure compresses the decision cycle. Roofing Contractor Magazine's 2026 State of Industry reports that 78% of contractors expect sales volume increases and 89% predict growth over the next three years — this supply-demand imbalance (growing demand, labor-constrained supply) supports conversion rates even in High competition environments. The plumbing PPC statistics dataset shows a parallel pattern: High competition classifications track with high CPL in plumbing but not in storm-driven categories like roofing.
| City | Competition | Avg CPC | Avg CPL | CVR |
|---|---|---|---|---|
| Very High Competition (3 markets) | ||||
| Denton, TX | Very High | $43.50 | n/a | 4.0% |
| Phoenix, AZ | Very High | $30.00 | n/a | 6.0% |
| Santa Rosa, CA | Very High | $10.52 | $115.00 | n/a |
| High Competition (6 markets) | ||||
| Houston, TX | High | $35.00 | $90.00 | 14.0% |
| McKinney, TX | High | $47.50 | n/a | 8.0% |
| San Antonio, TX | High | $14.00 | $145.00 | 9.0% |
| Grand Rapids, MI | High | n/a | $212.50 | n/a |
| New York, NY | High | n/a | $135.00 | n/a |
| Chicago, IL | High | n/a | n/a † | n/a |
| Medium Competition (4 markets) | ||||
| Corpus Christi, TX | Medium | $28.50 | $72.50 | 14.0% |
| Green Bay, WI | Medium | $20.00 | $175.00 | n/a |
| Laredo, TX | Medium | $30.50 | n/a | 7.5% |
| Rockford, IL | Medium | n/a | n/a † | n/a |
† Chicago IL and Rockford IL CPL values appear anomalous in source data and are excluded from lead cost analysis. Competition level data is available for 13 of 135 cities in this dataset.
Competition Level Distribution in Roofing PPC
What Budget Do You Need for Roofing Google Ads?
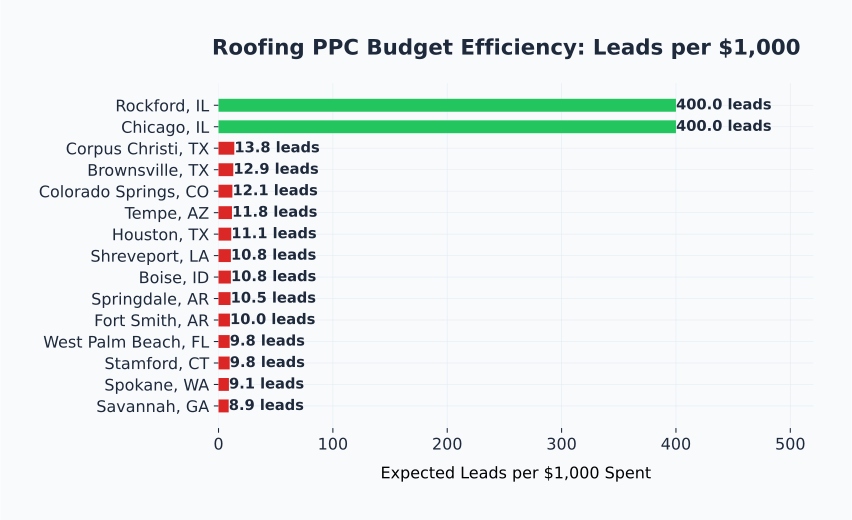
Roofing PPC is viable at $2,000/month in small markets like Brownsville TX ($7.25 CPC, $77.50 CPL, 12.9 leads per $1,000 spent) and scales to $4,750/month in premium markets like Norwalk CT. The median starter budget across 54 cities with budget data is $3,250/month — delivering 7.2 leads per $1,000 at the dataset median CPL of $138.75.
Market size does not determine minimum viable budget — market CPL does. Houston TX (2.4M population) requires a smaller effective budget than Lexington KY (171K population) because Houston's $90 CPL generates 11.1 leads per $1,000 versus Lexington's $300 CPL at 3.3 leads per $1,000. A roofing contractor should target 8–15 leads per month minimum; at the dataset median CPL, that requires $1,100–$2,080/month in ad spend — but at high-CPL Northeast markets, achieving 8 leads/month demands $1,900–$2,400/month. According to ProLine CRM's 2025 marketing survey, growth-oriented roofing SMBs allocate 10–15% of revenue to marketing — at the $25,840 average job value, a $3,000/month PPC investment needs to produce just 1.4 closed jobs to break even on a 30-day basis.
| Market Tier | Starter Budget | CPC Range | CPL Range | Leads per $1K | Example Markets |
|---|---|---|---|---|---|
| Small Market (<200K pop) | $2,000–$3,000 | $7–$16 | $75–$125 | 8–13 | Brownsville TX, Shreveport LA, Casper WY, Tempe AZ |
| Mid Market (200K–500K pop) | $2,500–$4,000 | $12–$32 | $80–$145 | 7–12 | Colorado Springs CO, Fort Smith AR, Raleigh NC, Boise ID |
| Large Market (500K–1M pop) | $3,000–$4,500 | $14–$35 | $130–$175 | 5–8 | Cleveland OH, El Paso TX, Portland OR, Seattle WA |
| Major Metro (1M+ pop) | $3,500–$6,000 | $14–$47 | $90–$215 | 5–11 | Houston TX ($90 CPL), Miami FL ($120), NYC ($135), Minneapolis MN ($175) |
Market Opportunity Score — Top 5 Cities (Score 1–10)
Composite rank: low CPL (40%) + high CVR (40%) + low CPC (20%). Cities with data available on all three metrics.
Budget Efficiency by Market
Roofing PPC Management
Need help optimizing your Roofing PPC spend?
See how MB Adv manages campaigns in McKinney TX, Denton TX, and Detroit MI — the highest-spend Roofing markets in our dataset.
Get a Free Roofing PPC Audit →When Is the Best Time to Run Roofing PPC?
Roofing PPC has the most event-driven demand cycle of any home services category. The primary storm season (March–June) accounts for 60–70% of annual replacement volume in hail-active markets, with CPL compressing 20–35% during active weather windows as insurance-claim buyers flood search with high intent. A secondary peak runs September–October for pre-winter inspections and age-triggered replacements.
The storm-surge dynamic fundamentally changes budget allocation strategy. In TX/CO/OK hail corridors, advertisers who maintain continuous campaigns capture surge demand within 48–72 hours of major events — the window before national lead-generation services and competitor roofing companies saturate the market. Roofing Contractor Magazine's 2026 Homeowner Survey confirms that 88% of contractors begin jobs within 2 weeks of quote acceptance — the urgency is real and the search-to-call cycle compresses dramatically post-storm.
According to Ahrefs keyword data (June 2026), "roof replacement" (99,000 monthly US searches) and "roof repair" (91,000 monthly searches) together form a 190,000-search monthly demand pool — with seasonal spikes after major hail events that can triple weekly search volume within 72 hours. Advertisers on continuous campaigns capture this organic demand surge; those running flight-based campaigns miss it entirely. The ServiceTitan industry statistics confirm that material costs have risen 35% since 2020, which means the urgency argument for timely replacement (before further cost increases) has become a genuinely compelling selling point in seasonal campaign messaging.
Recommended Roofing PPC Budget Allocation by Season
- April–August (storm season): 65–70% of annual budget. Max bids on storm-intent keywords: "hail damage roof," "storm damage roofer near me," "emergency roof repair [city]."
- September–October (fall inspection season): 15–20% of annual budget. Shift messaging to "roof inspection before winter," "roof age assessment," "pre-winter roof replacement."
- November–March (off-season): 10–15% of annual budget. Maintain emergency-only campaigns for wind/ice damage. Brand search only in low-competition markets. Use the period to build remarketing lists.
Florida, Gulf Coast, and Southeast markets operate on a different seasonal clock — hurricane season (June–November) replaces the Midwest hail pattern. Miami FL, Tampa FL, and Jacksonville FL all see demand spikes July–October tied directly to named storm activity rather than hail events. Advertisers in these markets need event-response protocols: bid adjustments and new campaign assets ready to deploy within hours of a named storm making landfall. The healthcare PPC statistics dataset provides a counterpoint — healthcare demand is the most seasonally stable of all home services categories, while roofing is unquestionably the most volatile.
Best Value Market
Corpus Christi, TX
Southeast Texas Gulf Coast
Storm-insurance buyers dominate demand. At $3,000/month, generates ~41 leads and ~12 closed jobs at 30% close rate = $310,080 revenue.
Most Expensive Market
Lexington, KY
Central Kentucky — Planned Replacement Dominated
Planned-replacement buyers with extended 2–4 week decision cycles. Requires high-quality landing pages and aggressive retargeting to close at competitive CPL.
Roofing PPC — Frequently Asked Questions
Running Roofing PPC campaigns?
Get a free audit based on your city's benchmark data from our 135-city dataset.
Request Free Audit →Data Methodology
This dataset covers 135 US cities aggregated from MB Adv Agency client campaign data (2024–2026) and WordStream-calibrated per-metro estimates. Of the 135 cities, 17 are directly observed from managed campaigns; 118 are per-metro estimates calibrated to LocaliQ 2025 Home Services Benchmarks using city-level population, homeownership, and competition density factors. Three extreme outliers were excluded from aggregate calculations: Bakersfield CA (raw CPC $14,000), Dallas TX (raw CPC $16,500), and Lafayette LA (raw CPC $12,500). Benchmark comparisons reference PPC Chief 2026 and IBISWorld industry data. CVR data is available for 24 cities and is directional rather than exhaustive. Data version: 2026-Q1.

As a Google Ads expert, I bring proven expertise in optimizing advertising campaigns to maximize ROI.
I specialize in sharing advanced strategies and targeted tips to refine Google Ads campaign management.
Committed to staying ahead of the latest trends and algorithms, I ensure that my clients receive cutting-edge solutions.
My passion for digital marketing and my ability to interpret data for strategic insights enable me to offer high-level consulting that aims to exceed expectations.
Google Partner Agency
We're a certified Google Partner Agency, which means we don’t guess — we optimize withGoogle’s full toolkit and insider support.
Your campaigns get pro-level execution, backed by real expertise (not theory).

4.9 out of 5 from 670+ reviews on Fiverr.
That’s not luck, that’s performance.
Highly recommend Matteo to set up your server side tracking. He has a deep understanding of e-commerce tracking and will go above and beyond to make sure everything is set up correctly and working 100%. If you are scaling your store this set up is non-negotiable in my opinion and there isn't many people who have this much knowledge or put the effort in to get it right. Thanks again!
avorodesign.com
I can only recommend Matteo! He was very patient, professional and very knowledgeable about GA4, Consent Mode v2, and GDPR compliance. Communication was clear, and the setup was done professionally and efficiently. Highly recommend him for anyone needing reliable tracking implementation.

www.natureiki.life
Matteo shines in the realm of online professionals. His work is not only deep in data but also complemented by his proactive communication and cooperation, setting a new standard for freelancers. If you want someone who truly exceeds expectations, look no further. Highly recommended!

www.omanbeverlysmyth.com
Exceptional Service Beyond Expectations - Outstanding Service Impeccable depth, flawless delivery, and exceptional language fluency—this service exceeded all expectations. Highly recommended. Matteo truly ROCKS!!!

ium-paris.com
Top-notch, always highly value working with Matteo. An absolute Google Ads Genius. This is approximately the 8th time I have hired him and he's helped us get 6-7 ROAS. We are excited in continuing to improve our lead flow. Hire this guy if you need Google Ads help. Thanks Matteo!

www.dleeventgroup.com
I finally found the guy who can setup server side tracking and all the ecosystem properly. I definitely recommend Matteo. He is very responsive, kind and wants to dig into things. He configured GA4, Meta, Google Ads, Outbrain and google consent v2 with Cookiebot. Thanks Matteo.

inomega.fr
MB Adv delivered exceptional work with outstanding professionalism and lots of patience, taking time to see effects of changes made and not just do the work and submit it. The proactive communication and video summaries of the work completed made working with Matteo a pleasure, as he consistently went above and beyond. Highly recommended for web analytics projects! We are already working on another project.

www.withnellsensors.co.uk
Working with Matteo on my Google Ads was a game-changer. He's not just a strategist, he's a true partner. He understood my goals and tailored a campaign that perfectly reached my target audience. I'm grateful for his expertise and dedication.

dccargo.com
Click-driven mind
with plastic-brick obsession.
We build Google Ads campaigns with the same mindset we use to build tiny brick worlds: strategy, patience, and zero tolerance for wasted pieces.
Data is our blueprint. Growth is the only acceptable outcome.